Figure/Table detail
Winter Wheat Yield Prediction Using UAV-Based Multispectral Time-Series Imagery
Journal of Nuclear Agricultural Sciences,
2026, 40(2):
413-422.
DOI: 10.11869/j.issn.1000-8551.2026.02.0413
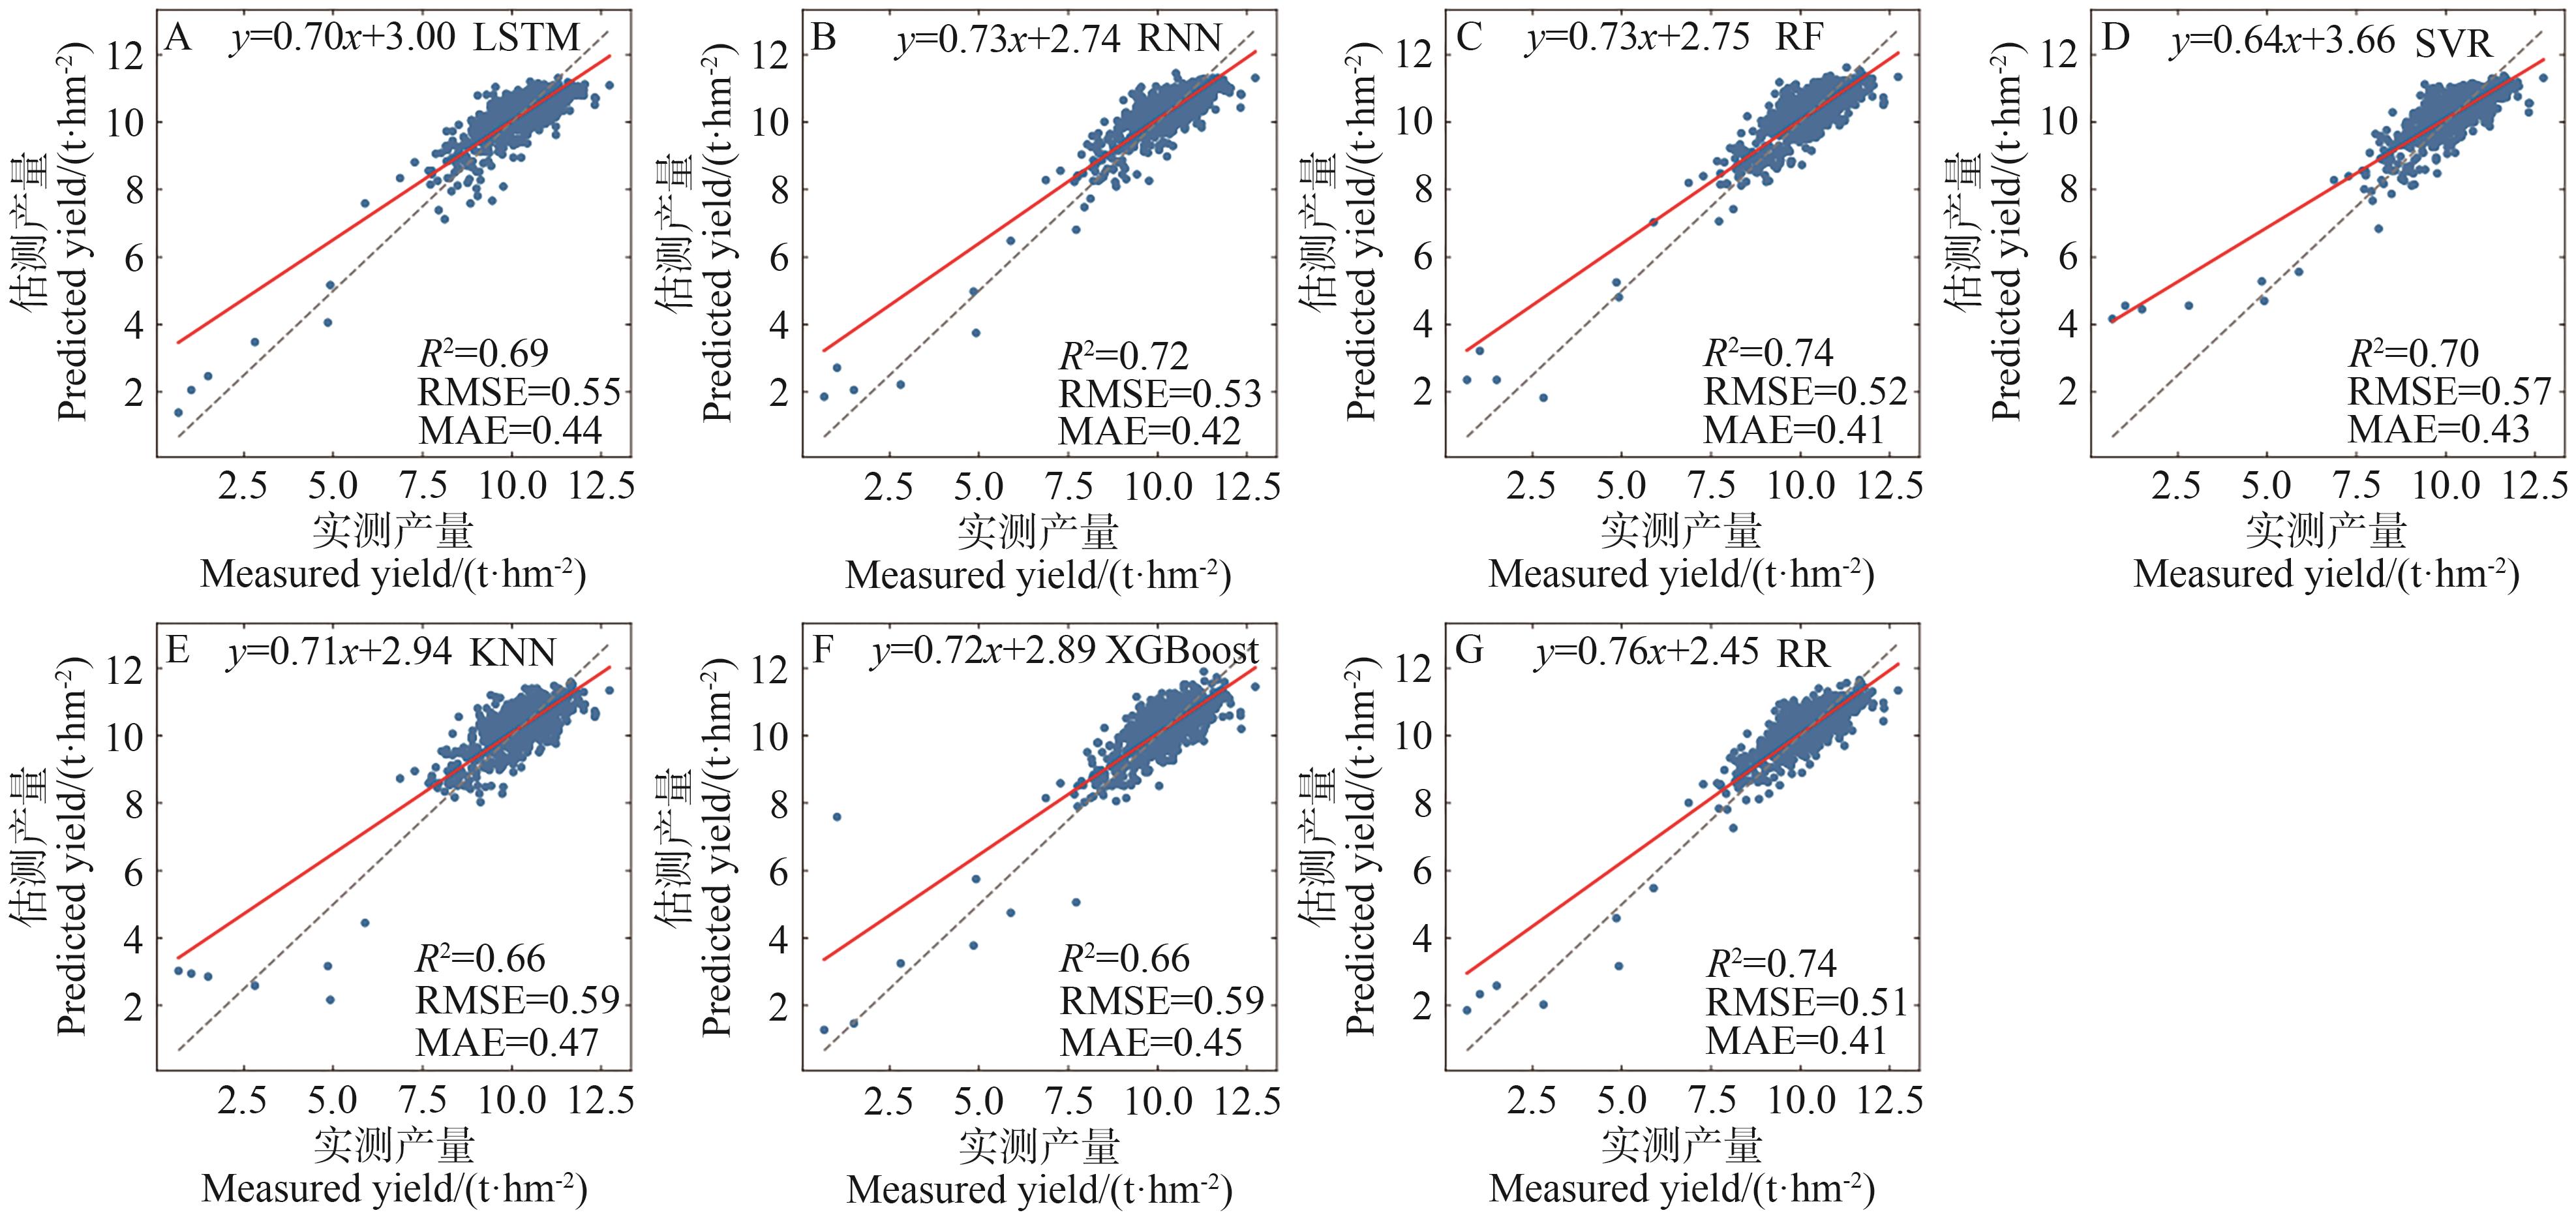
Fig.8 Scatter plots of predicted vs. observed yield values based on stratified sampling method
Note: A, B, C, D, E, F, and G represent the LSTM, RNN, RF, SVR, KNN, XGBoost, and RR models, respectively. The gray dashed line represents the 1∶1 line between the actual production and the model prediction, the red line is the fitted line for the observed and predicted values, RMSE and MAE units are t·hm-2.
Other figure/table from this article