×
模态框(Modal)标题
在这里添加一些文本
Close
Close
Submit
Cancel
Confirm
×
模态框(Modal)标题
×
Rss
Email Alert
Toggle navigation
Home
About Journal
Editorial Board
Editorial Board
Notes for Contribution
News
Contact Us
中文
Figure/Table detail
Winter Wheat Yield Prediction Using UAV-Based Multispectral Time-Series Imagery
WAN Guoliang, WANG Yinting, LI Lei, WANG Duoxia, TAO Zhiqiang, SUN Haiyan
Journal of Nuclear Agricultural Sciences
, 2026, 40(
2
): 413-422. DOI:
10.11869/j.issn.1000-8551.2026.02.0413
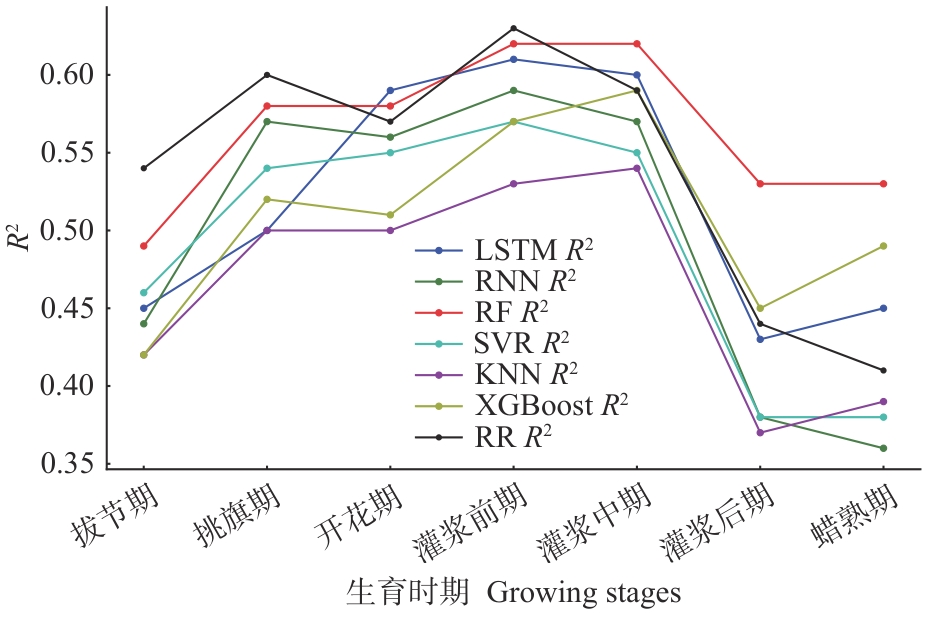
Fig.4
Coefficient of determination (
R
²) of crop yield prediction at different growth stages using various machine learning models
Other figure/table from this article
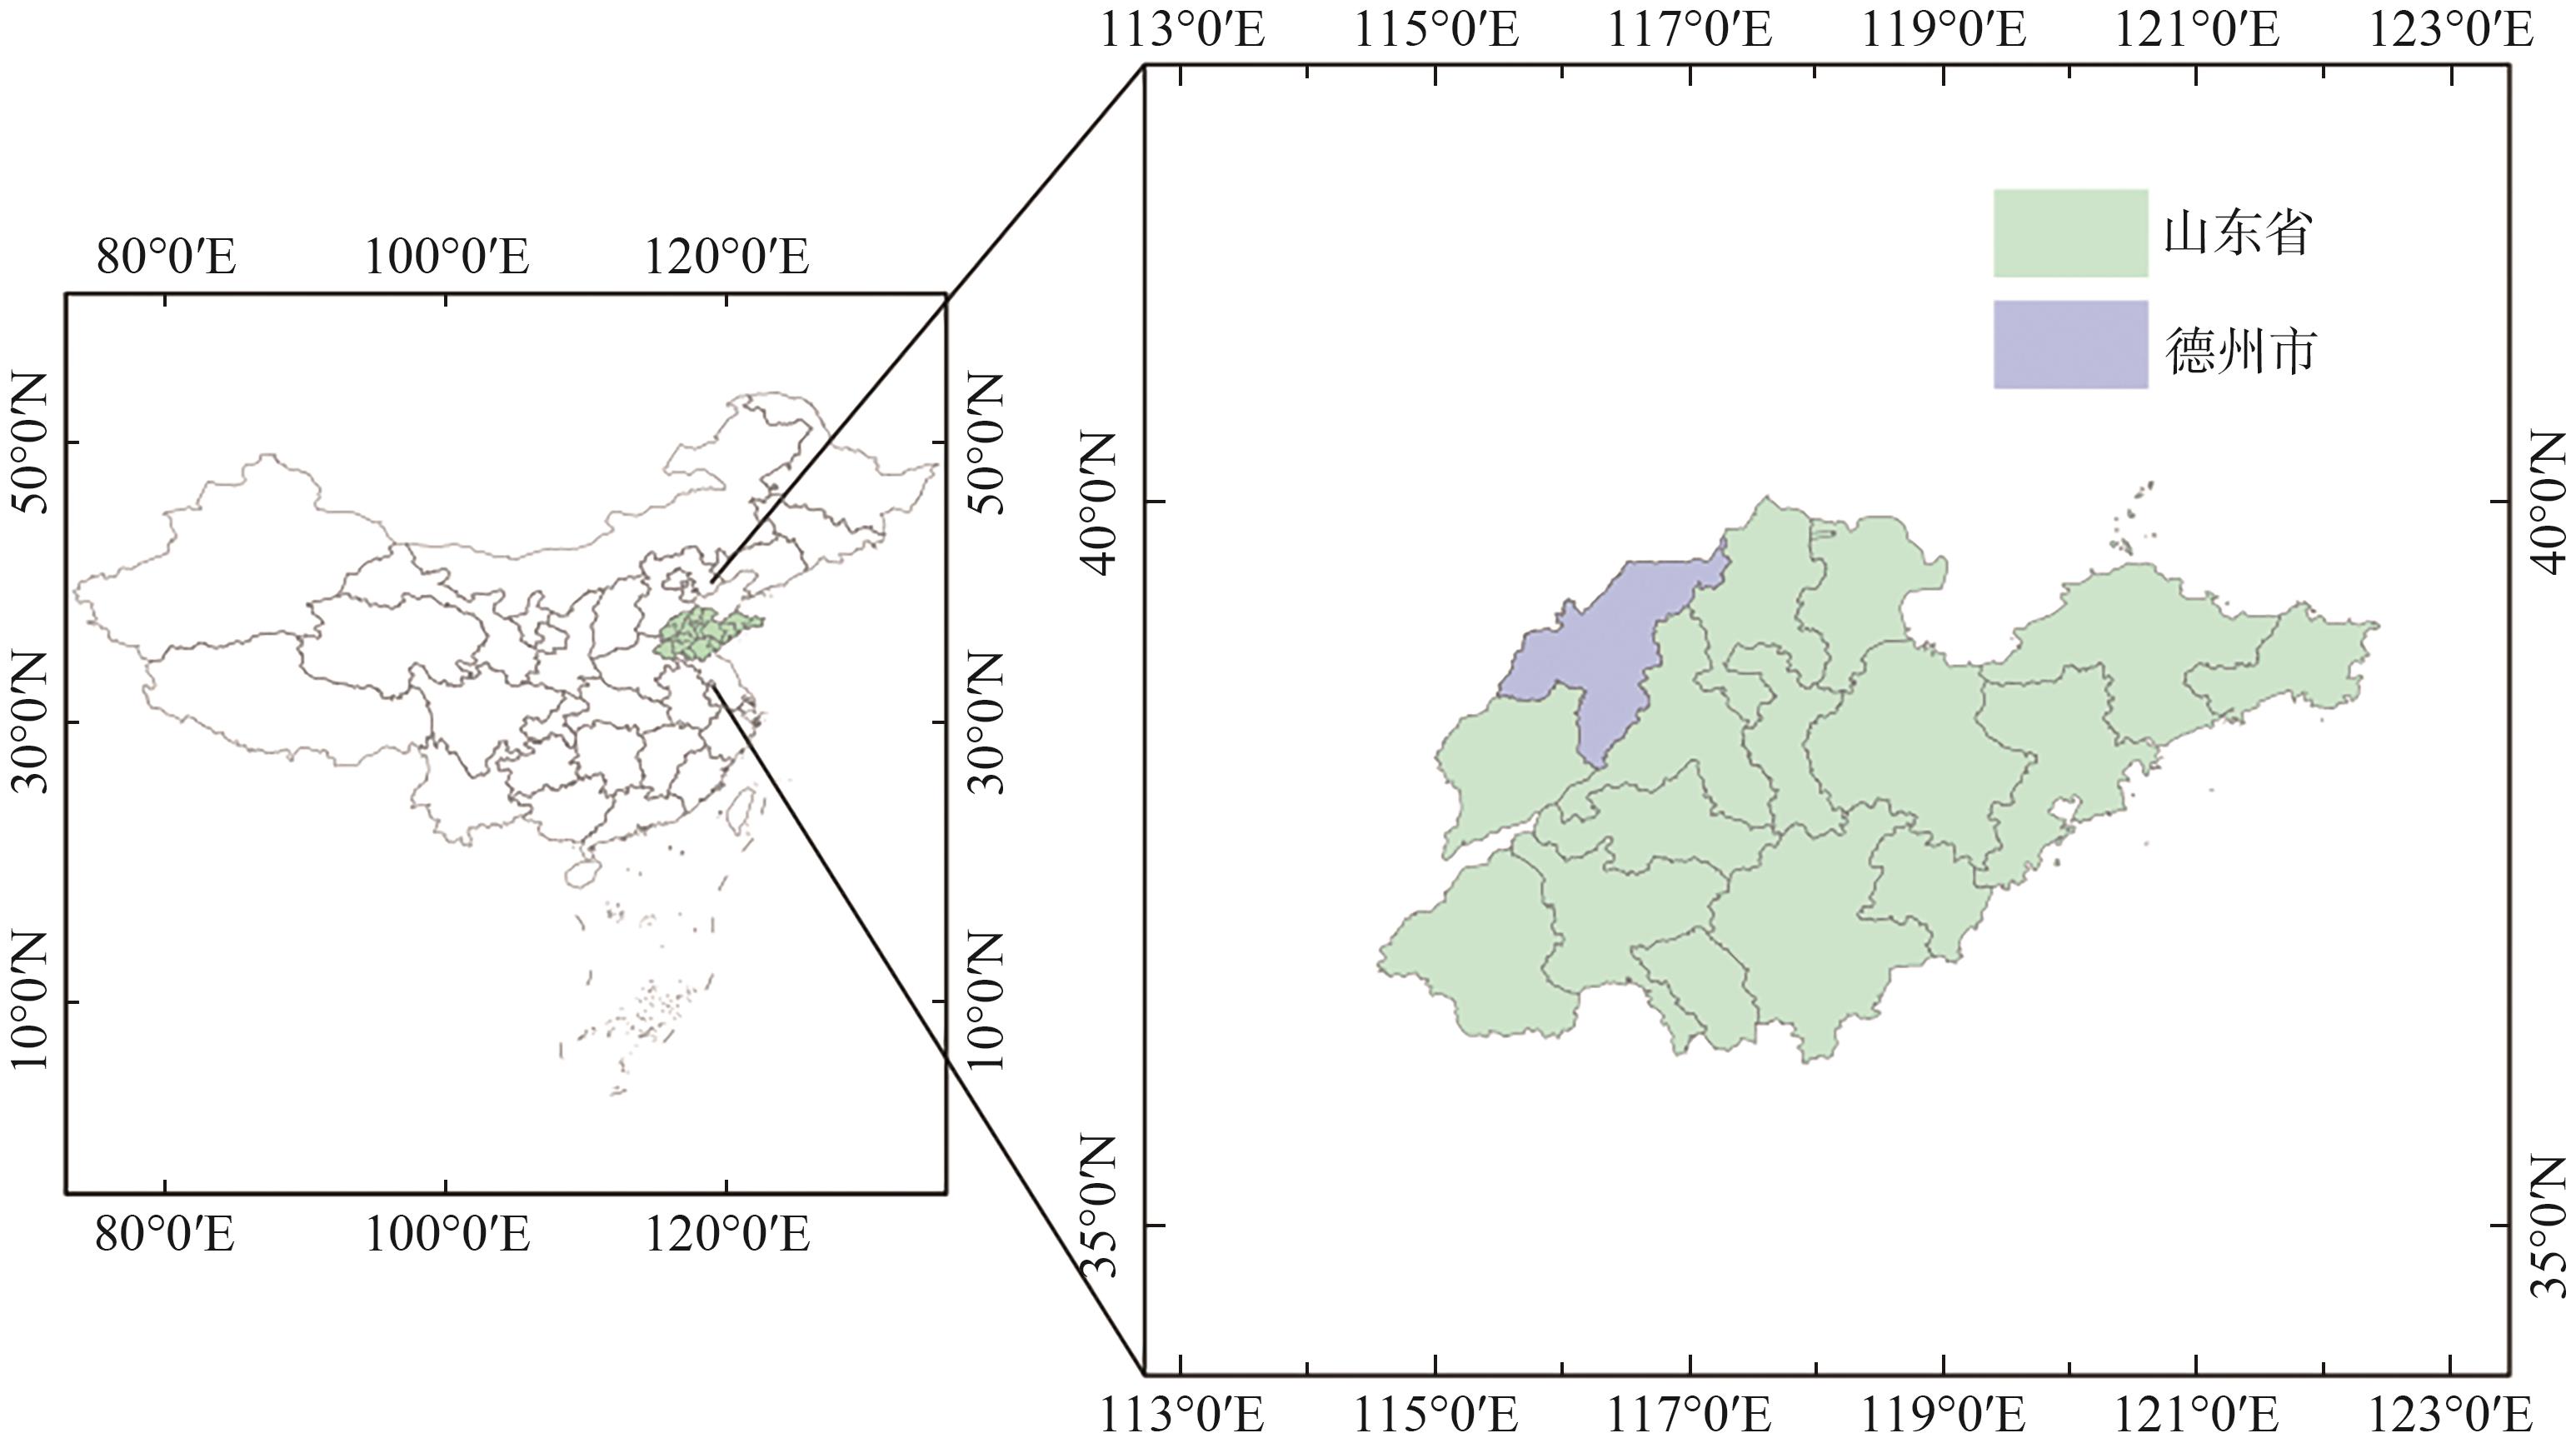
Fig.1
Test location map
Table 1
Drone field data collection schedule
Table 2
Multispectral vegetation indices used in the study
Fig.2
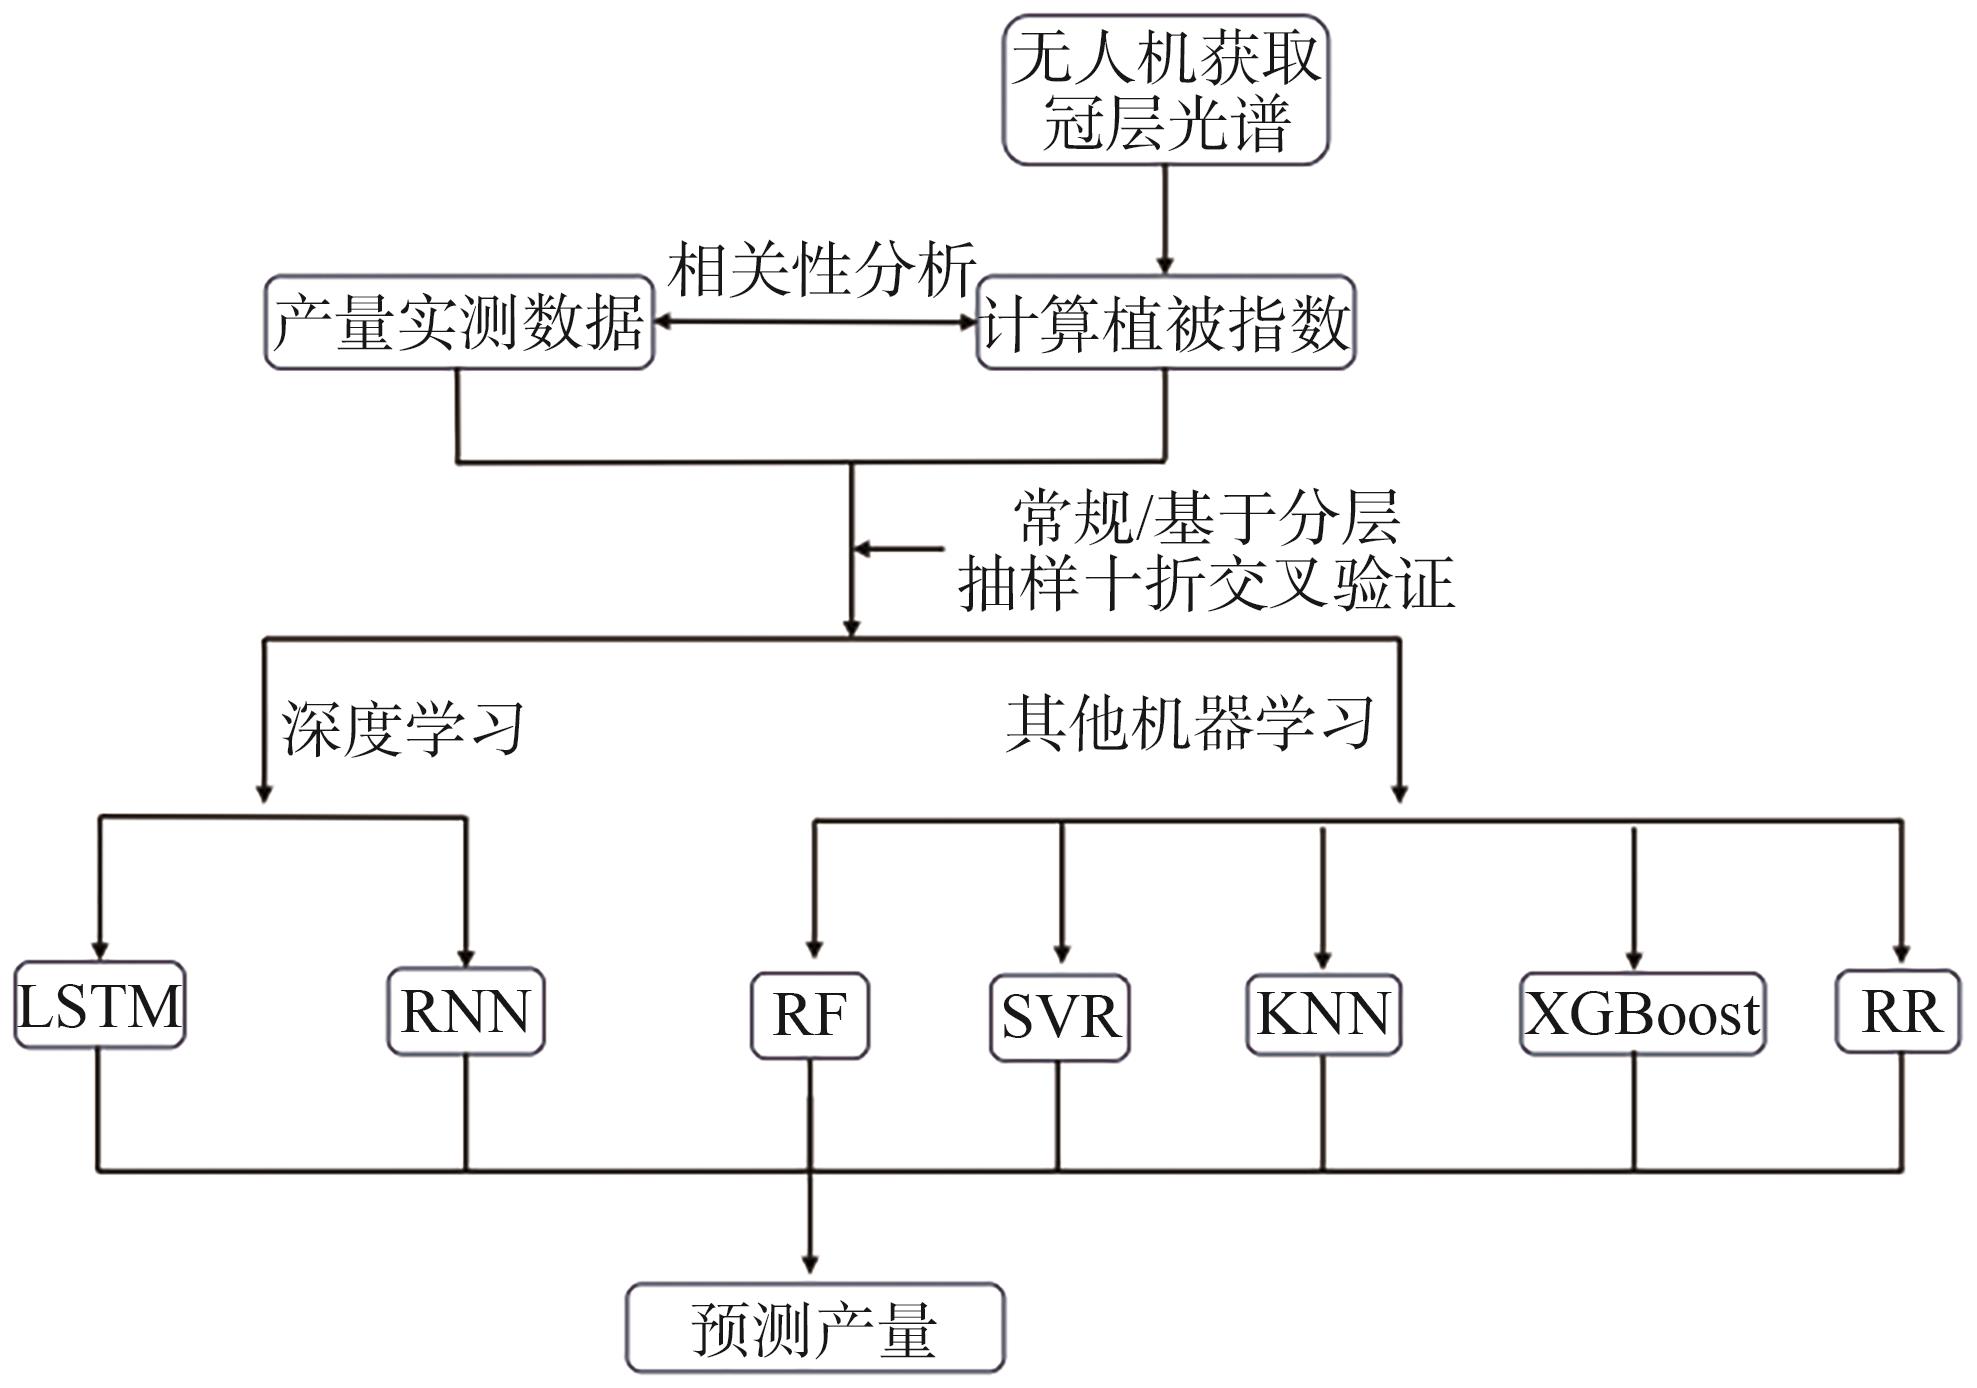
Flowchart of establishing yield estimation model with multispectral data
Fig.3
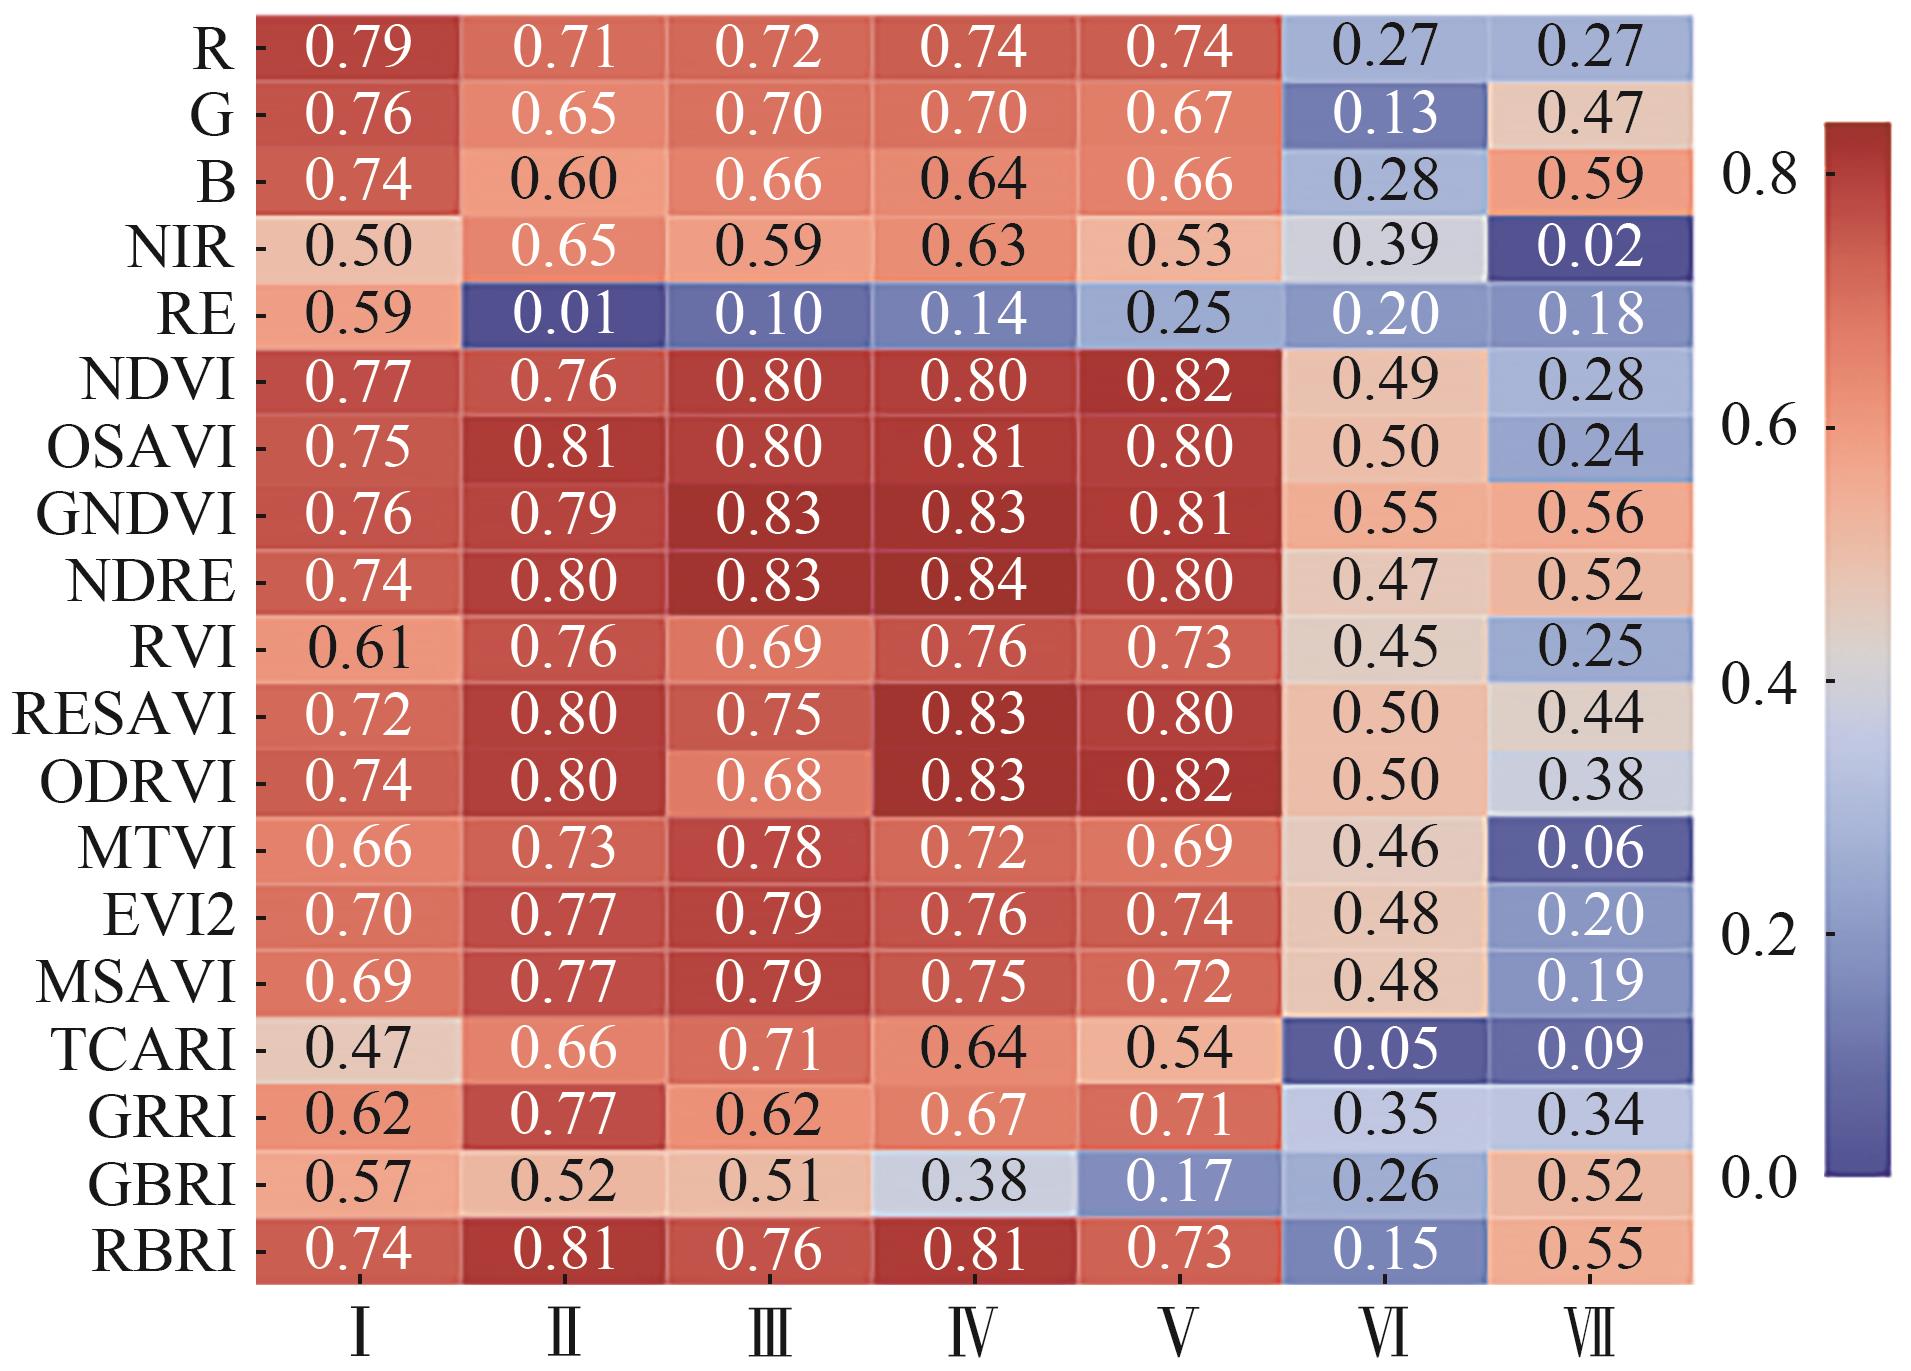
Correlation between multi-spectral bands and vegetation index and measured yield in the plot
|r|
Note:
Ⅰ: Elongation stage. Ⅱ: Flag leaf stage. Ⅲ: Flowering stage. Ⅳ: Early grain-filling stage. Ⅴ: Middle grain-filling stage. Ⅵ: Late grain-filling stage. Ⅶ: Wax-ripening stage.
Fig.5
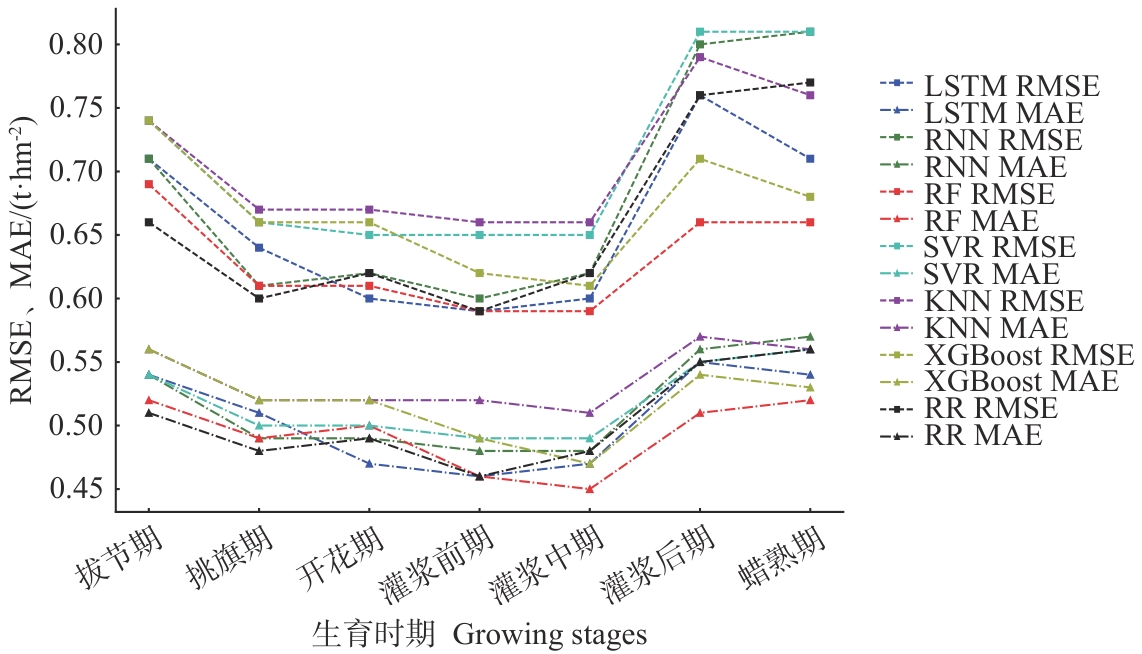
Root RMSE and MAE of crop yield prediction at different growth stages using various machine learning models
Fig.6
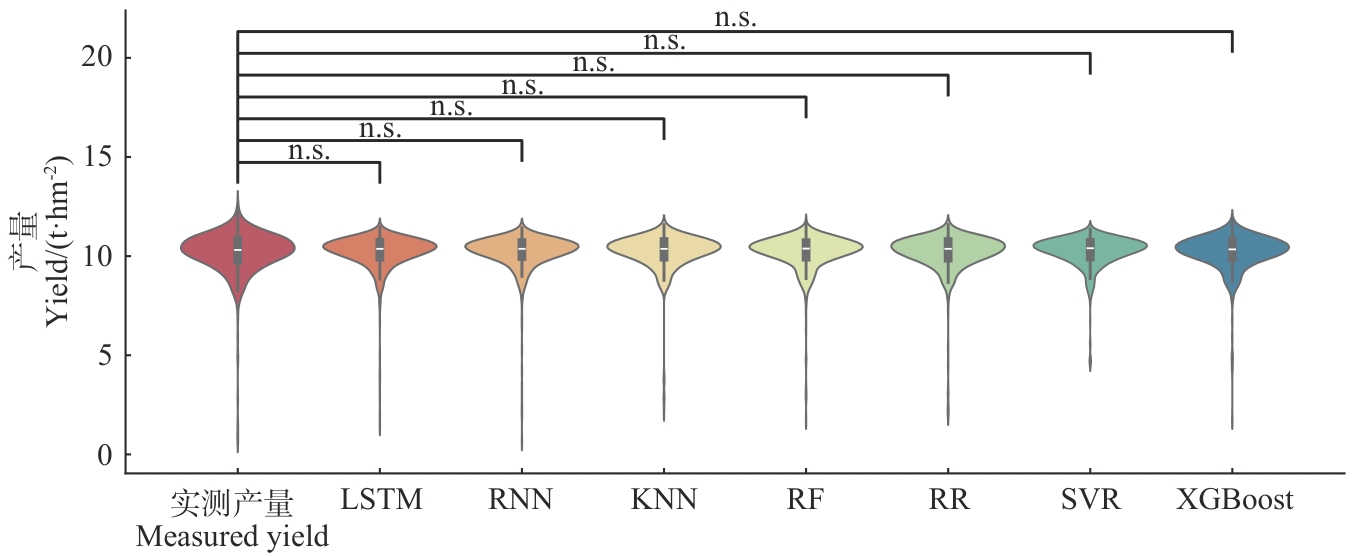
Violin diagram of yield prediction values cross-validated by different machine learning models
Note:
n.s.: Significance levels are
P
>0.05.
Fig.7
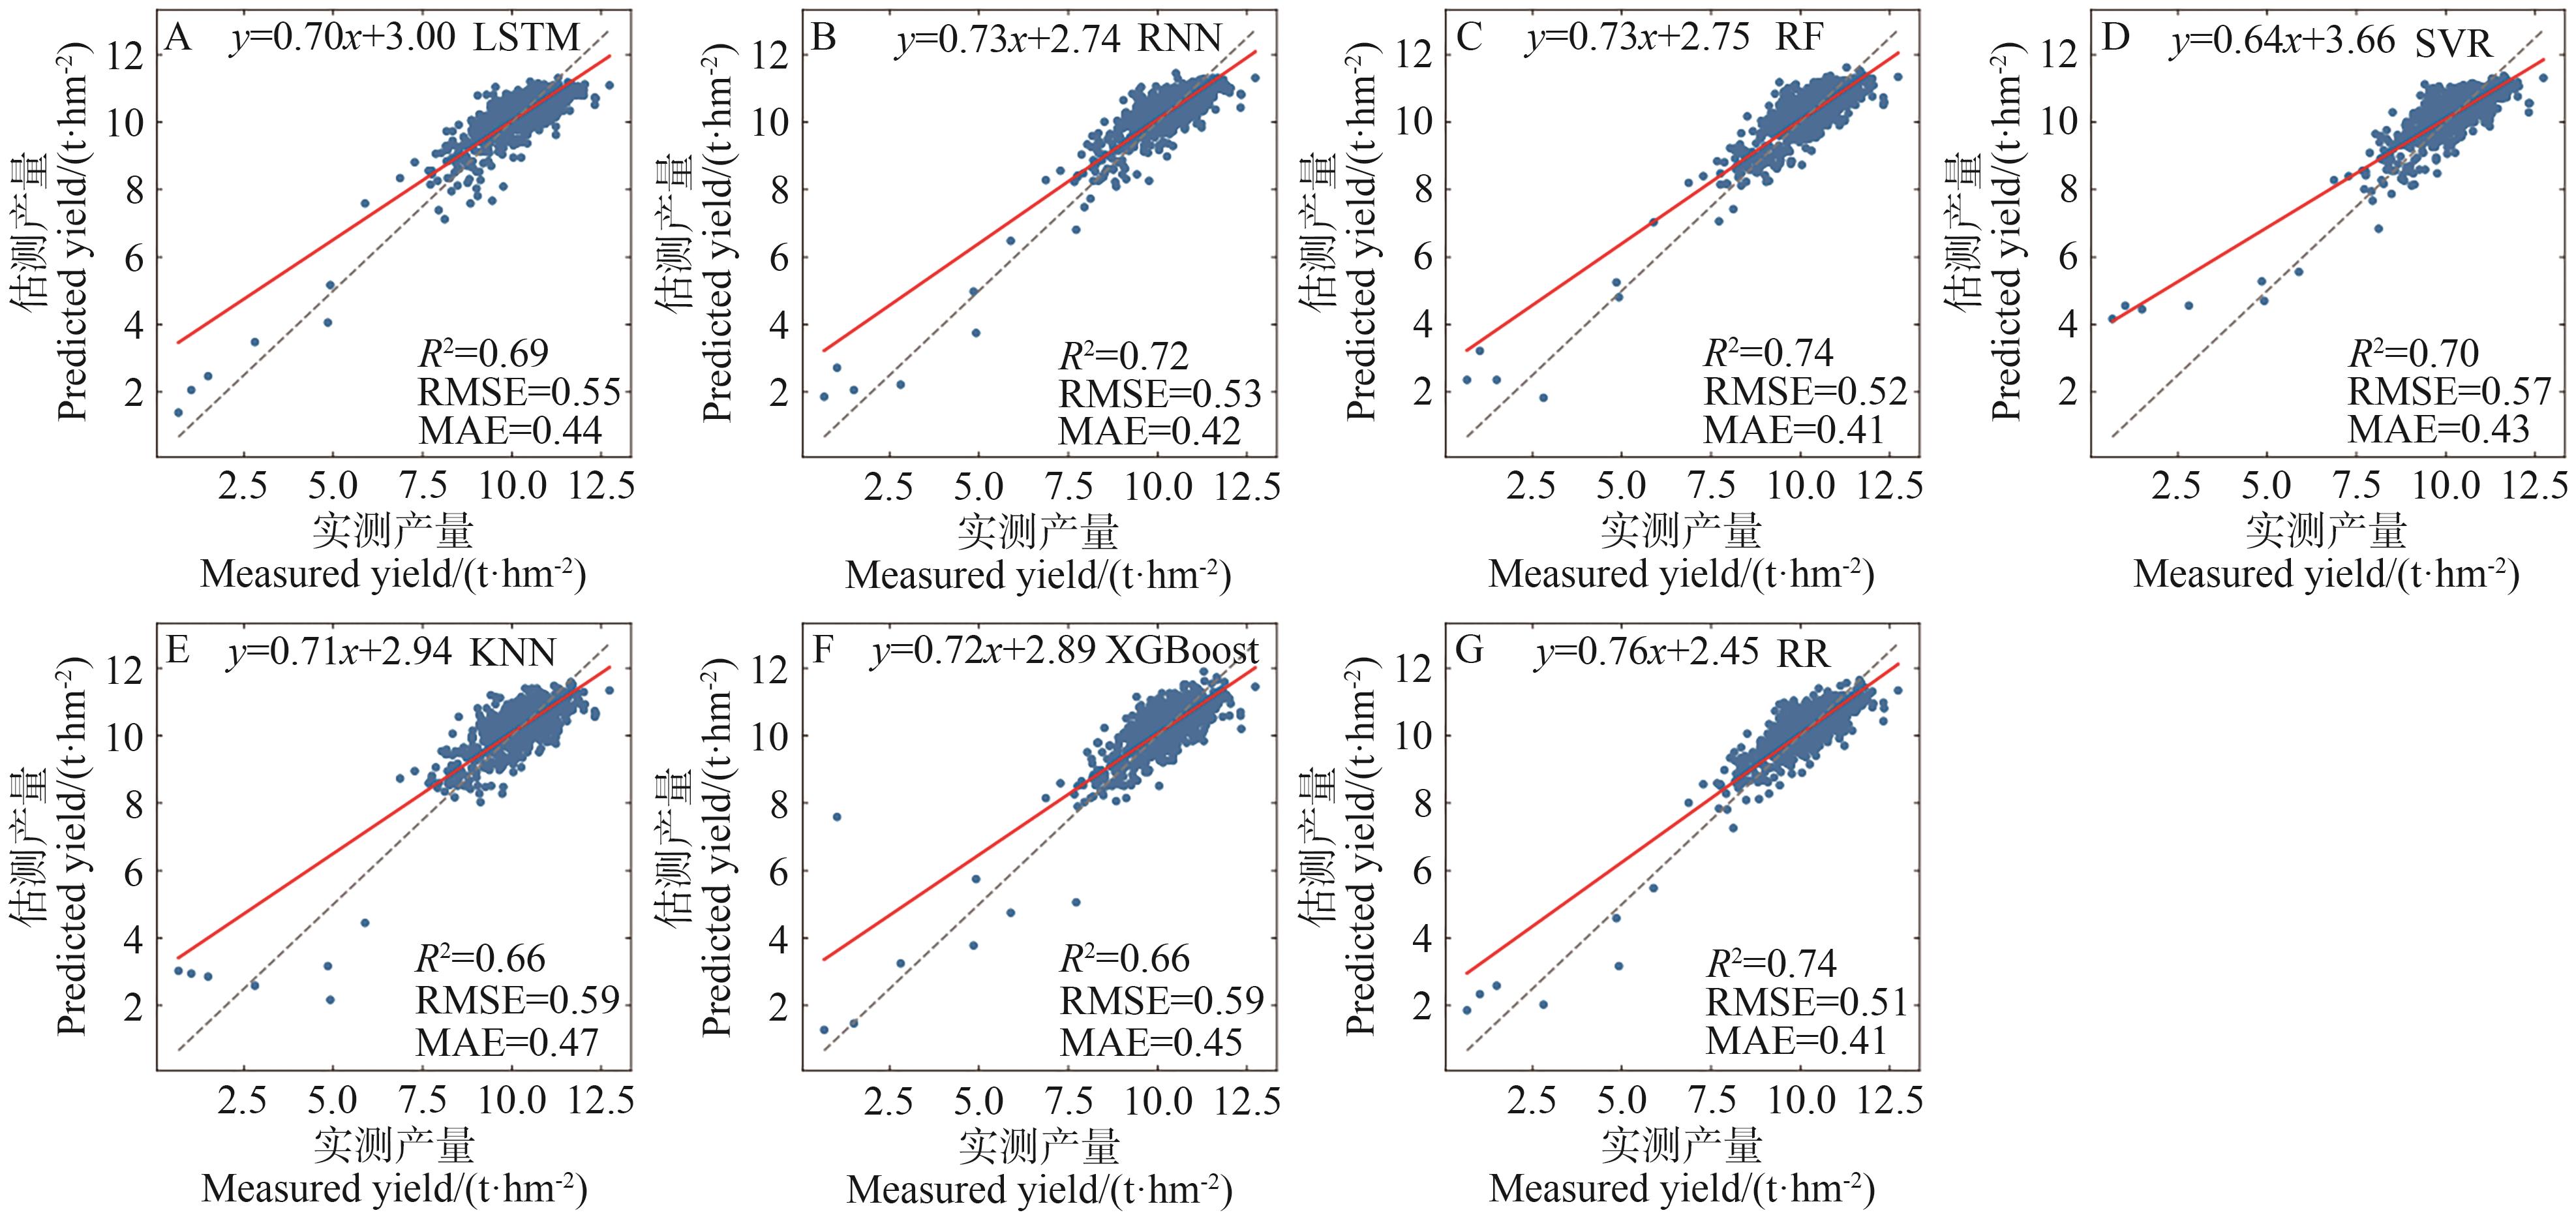
Scatter plots of predicted vs. observed yield values for each model
Note:
A, B, C, D, E, F, and G represent the LSTM, RNN, RF, SVR, KNN, XGBoost, and RR models, respectively. The gray dashed line represents the 1∶1 line between the actual production and the model prediction, the red line is the fitted line for the observed and predicted values, RMSE and MAE units are t·hm
-2
.
Fig.8
Scatter plots of predicted vs. observed yield values based on stratified sampling method
Note:
A, B, C, D, E, F, and G represent the LSTM, RNN, RF, SVR, KNN, XGBoost, and RR models, respectively. The gray dashed line represents the 1∶1 line between the actual production and the model prediction, the red line is the fitted line for the observed and predicted values, RMSE and MAE units are t·hm
-2
.
Fig.9
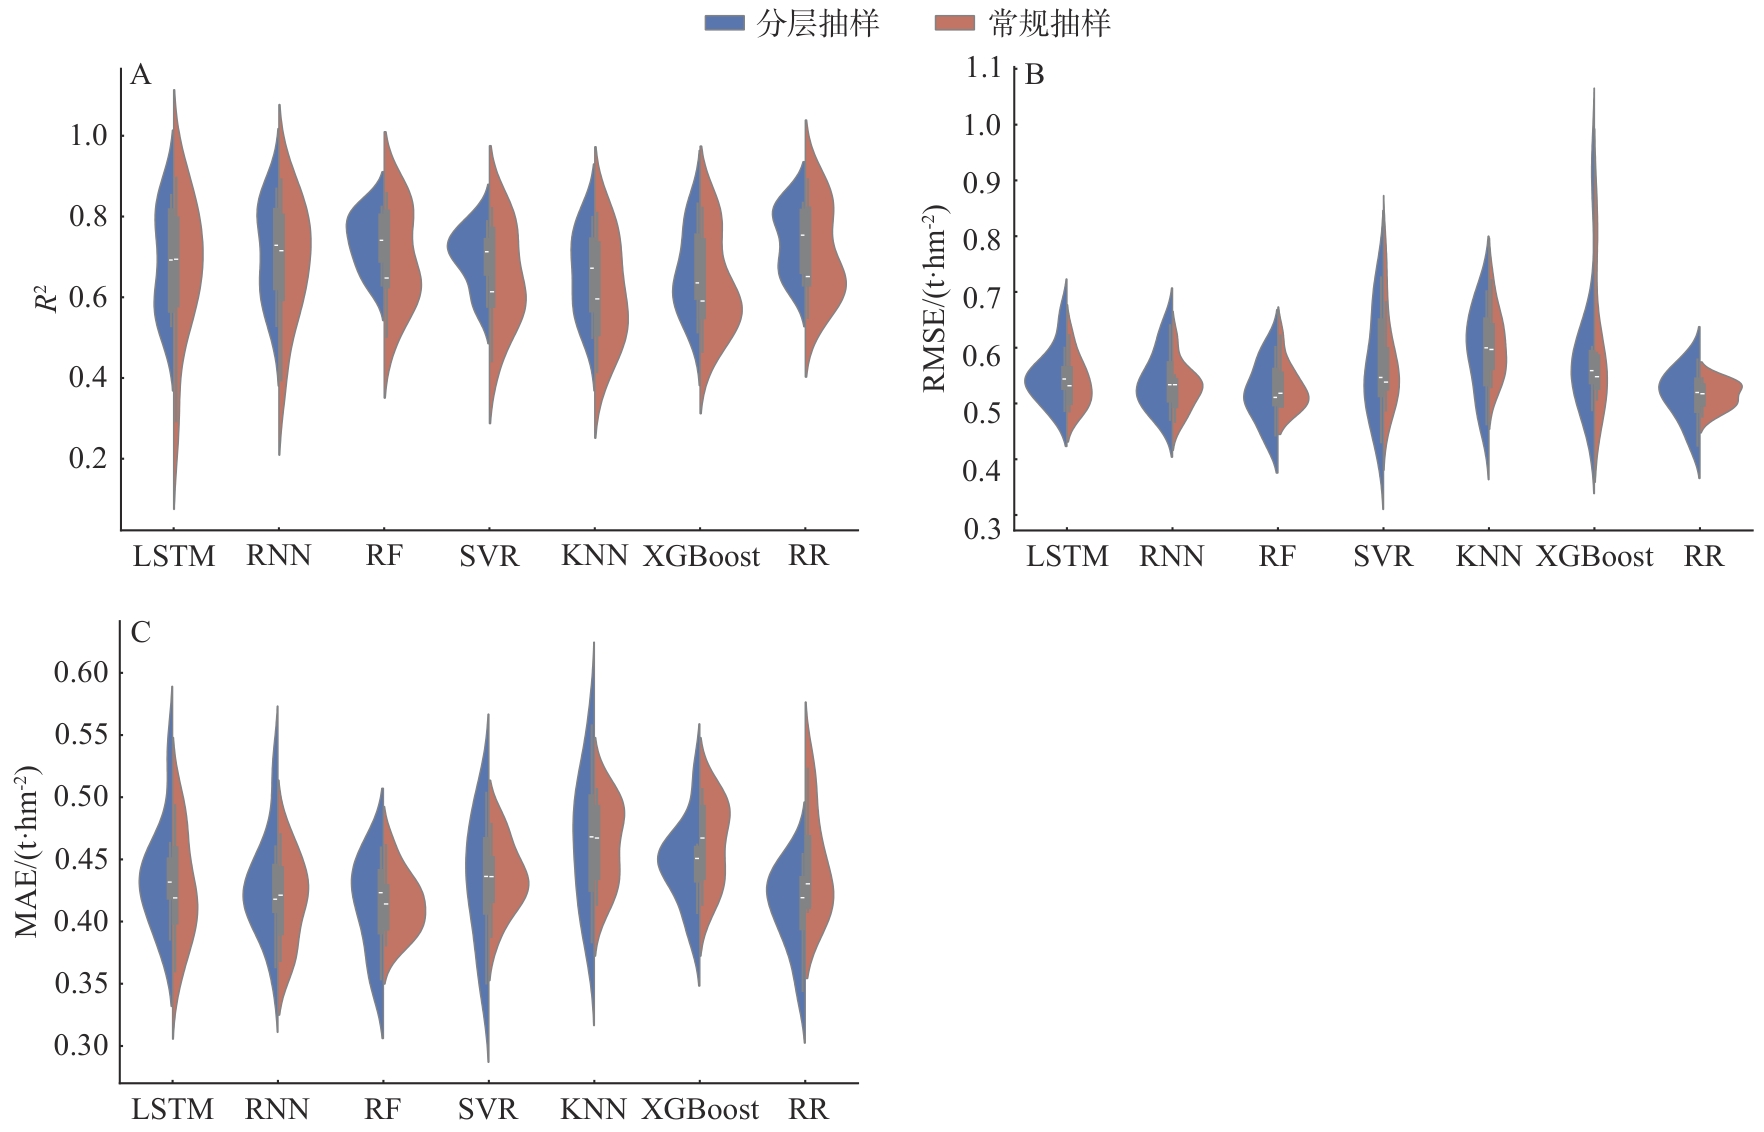
Comparison of prediction accuracy of machine learning models using random sampling and stratified sampling methods