×
模态框(Modal)标题
在这里添加一些文本
Close
Close
Submit
Cancel
Confirm
×
模态框(Modal)标题
×
Rss
Email Alert
Toggle navigation
Home
About Journal
Editorial Board
Editorial Board
Notes for Contribution
News
Contact Us
中文
Figure/Table detail
Winter Wheat Yield Prediction Using UAV-Based Multispectral Time-Series Imagery
WAN Guoliang, WANG Yinting, LI Lei, WANG Duoxia, TAO Zhiqiang, SUN Haiyan
Journal of Nuclear Agricultural Sciences
, 2026, 40(
2
): 413-422. DOI:
10.11869/j.issn.1000-8551.2026.02.0413
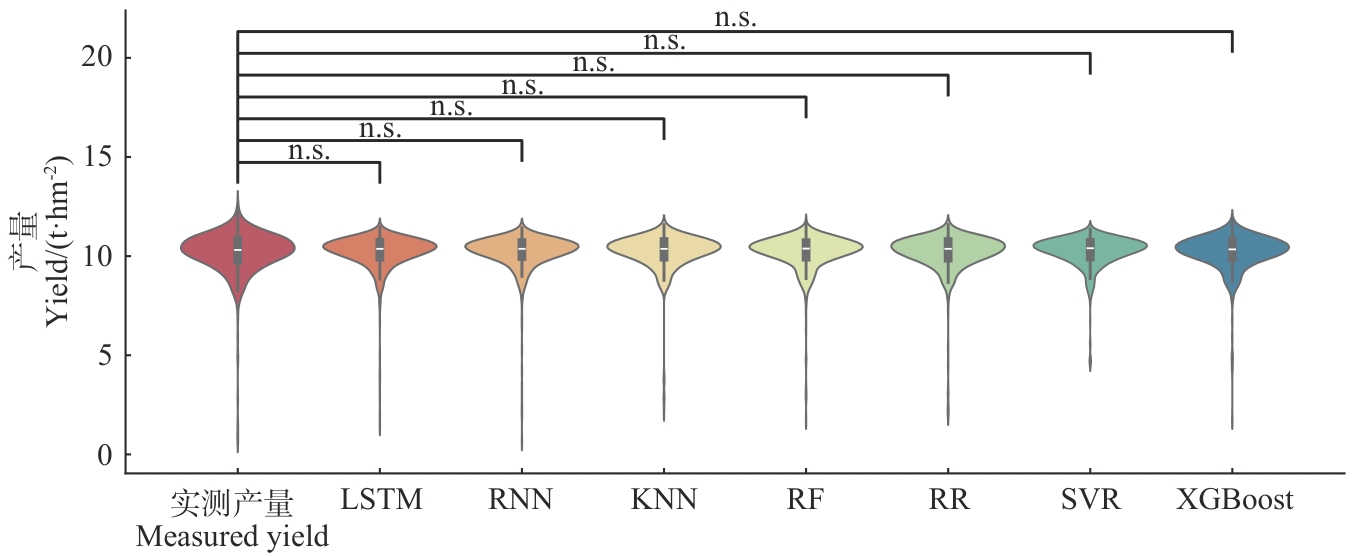
Fig.6
Violin diagram of yield prediction values cross-validated by different machine learning models
Note:
n.s.: Significance levels are
P
>0.05.
Other figure/table from this article
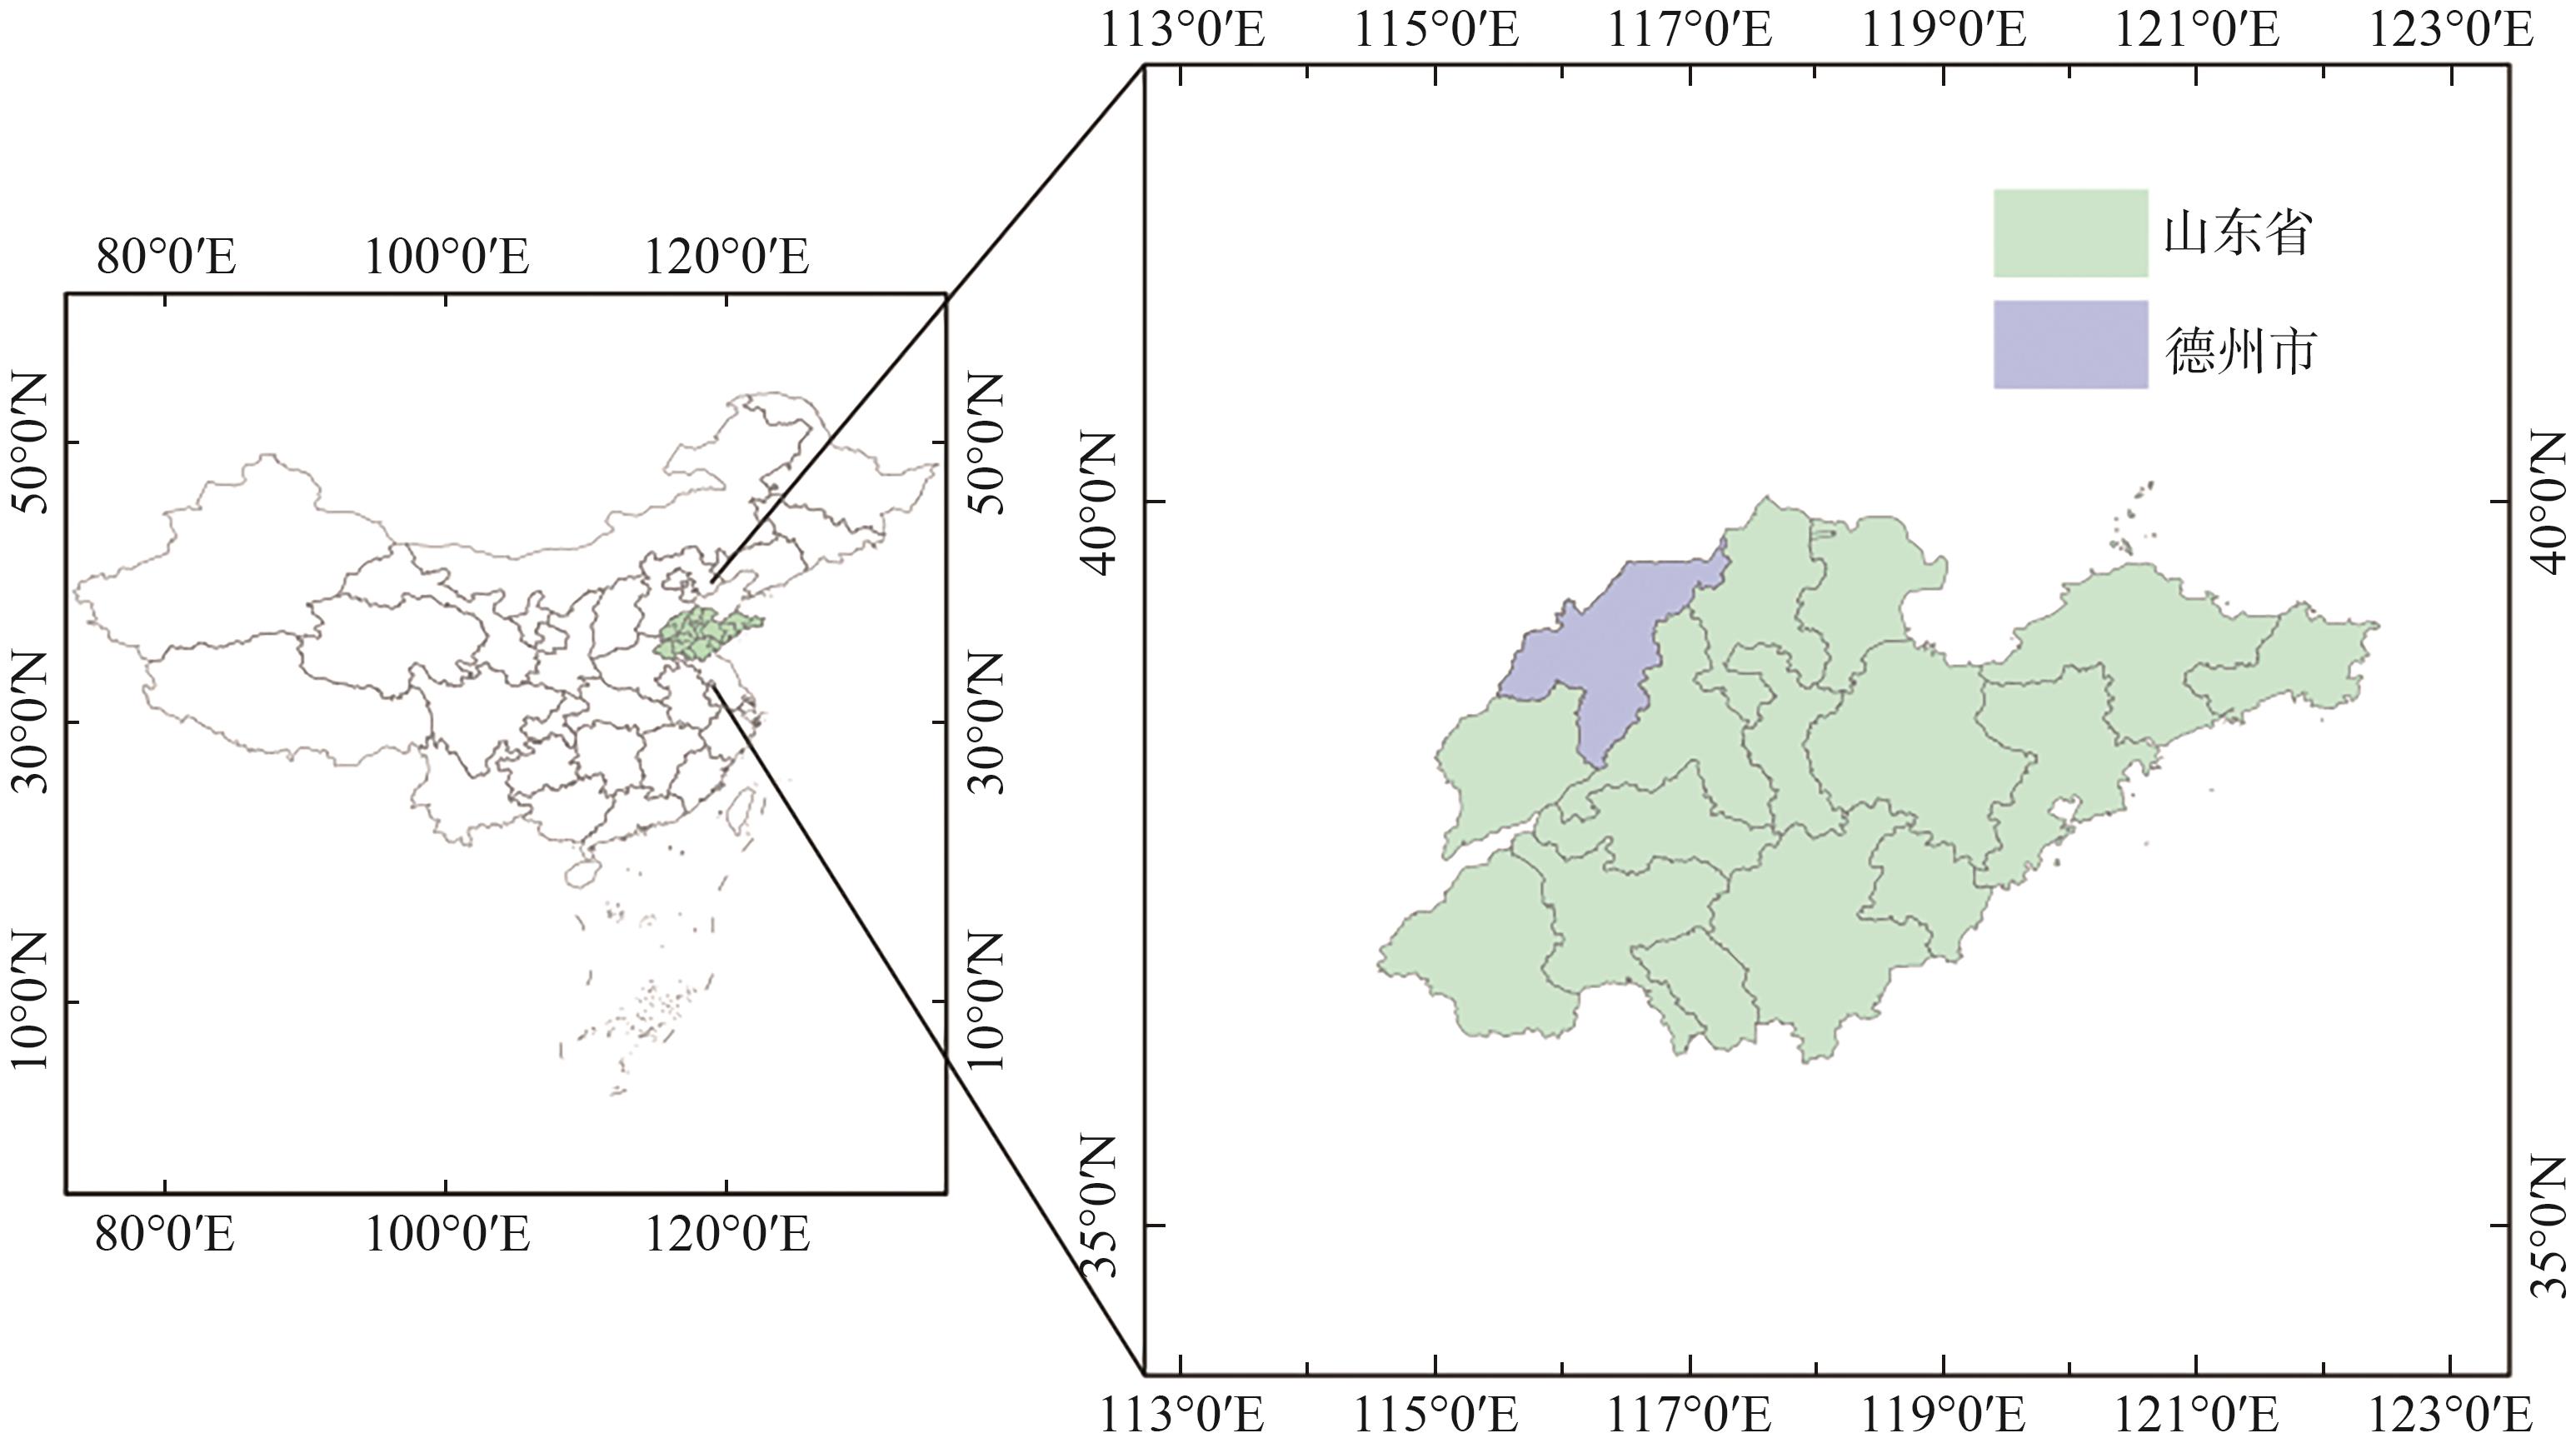
Fig.1
Test location map
Table 1
Drone field data collection schedule
Table 2
Multispectral vegetation indices used in the study
Fig.2
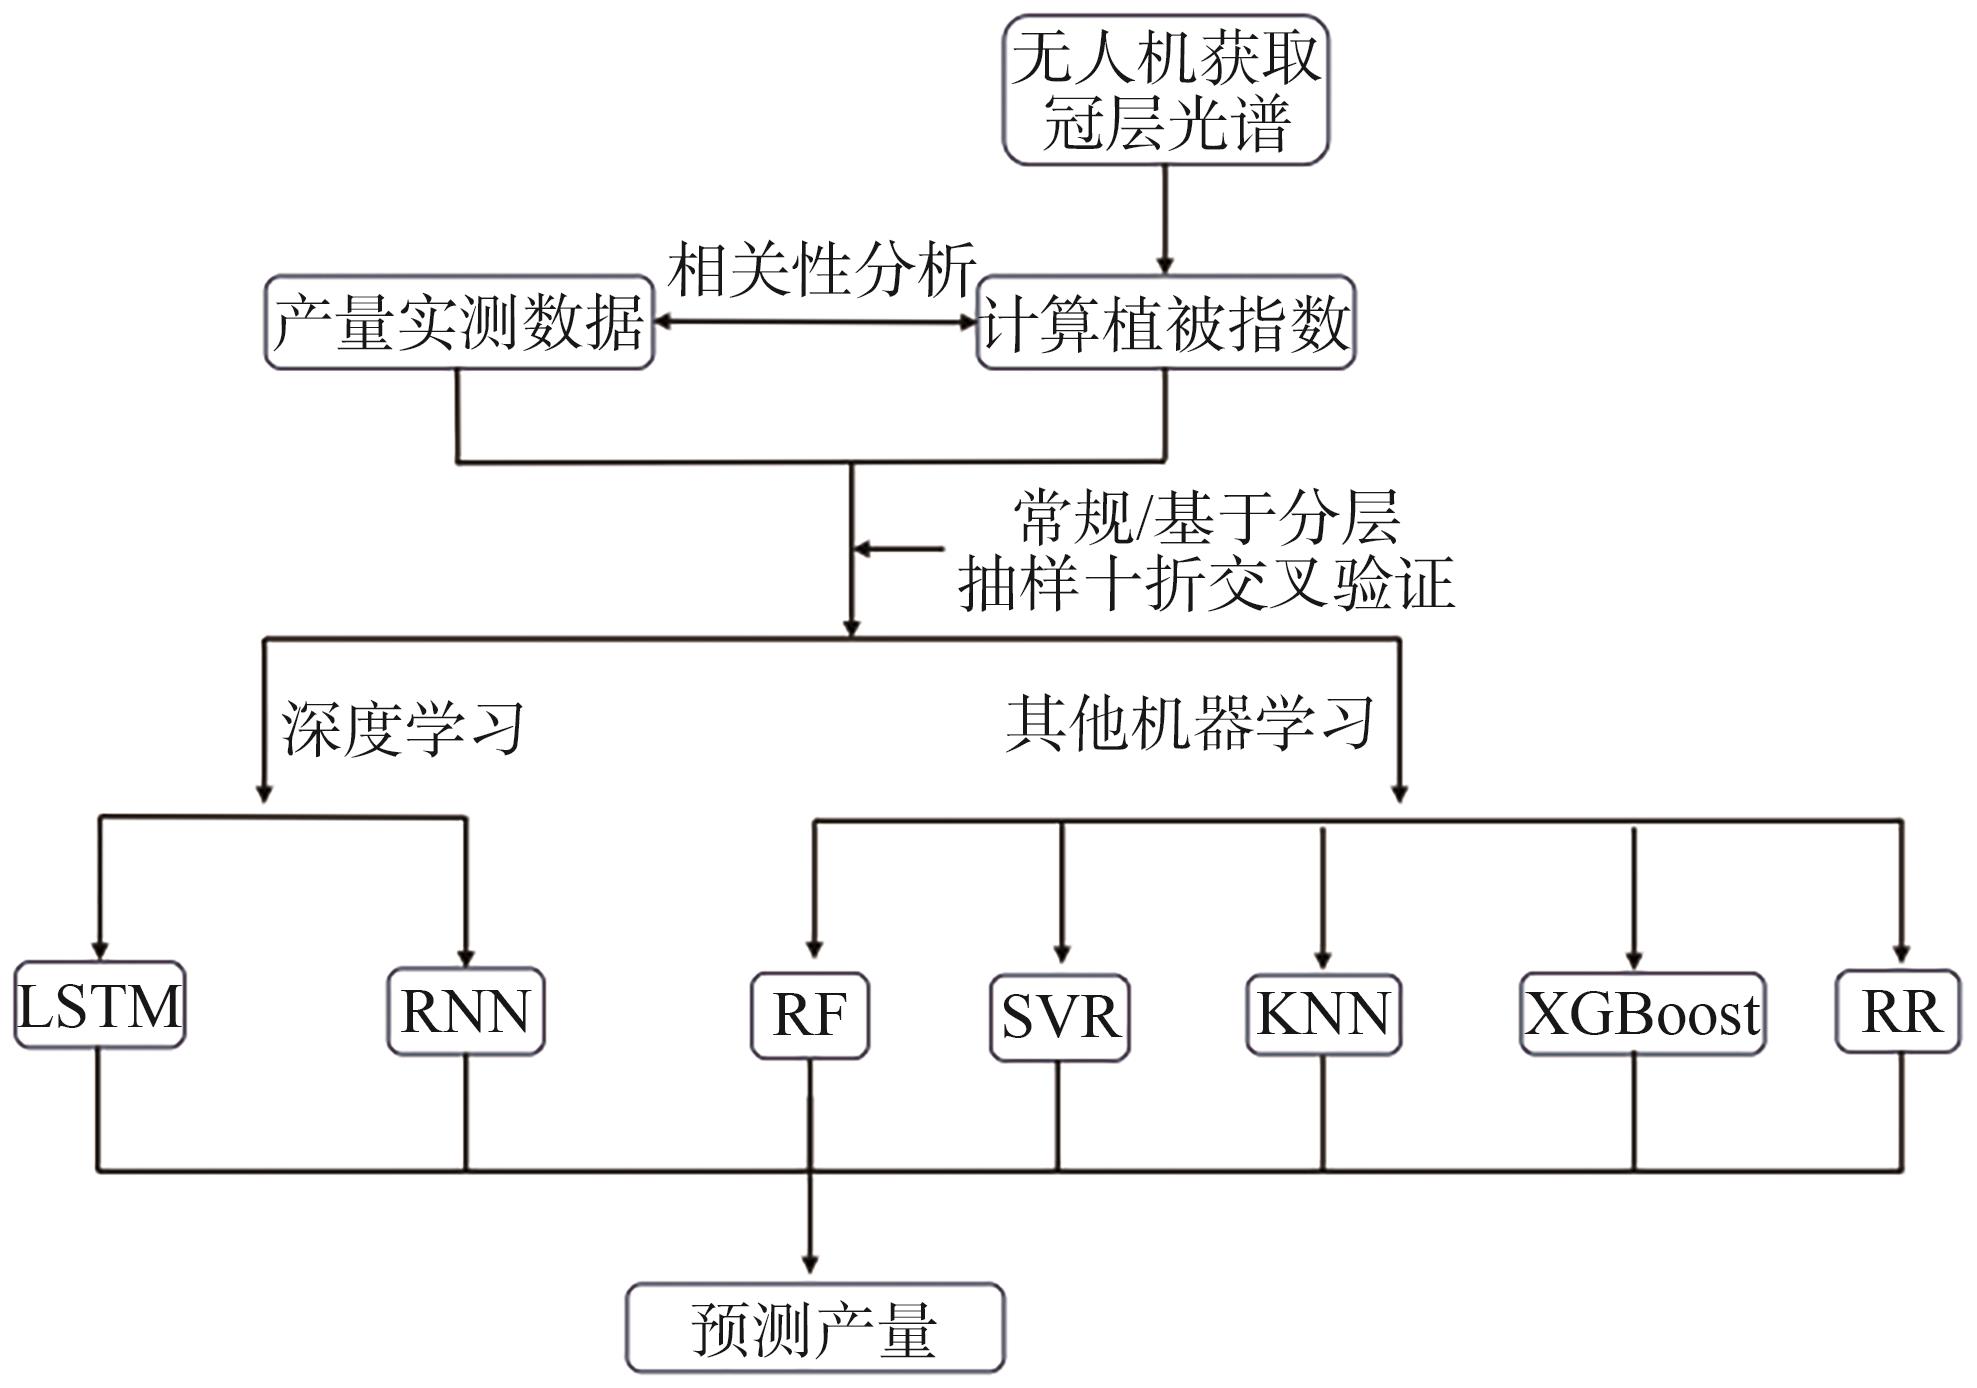
Flowchart of establishing yield estimation model with multispectral data
Fig.3
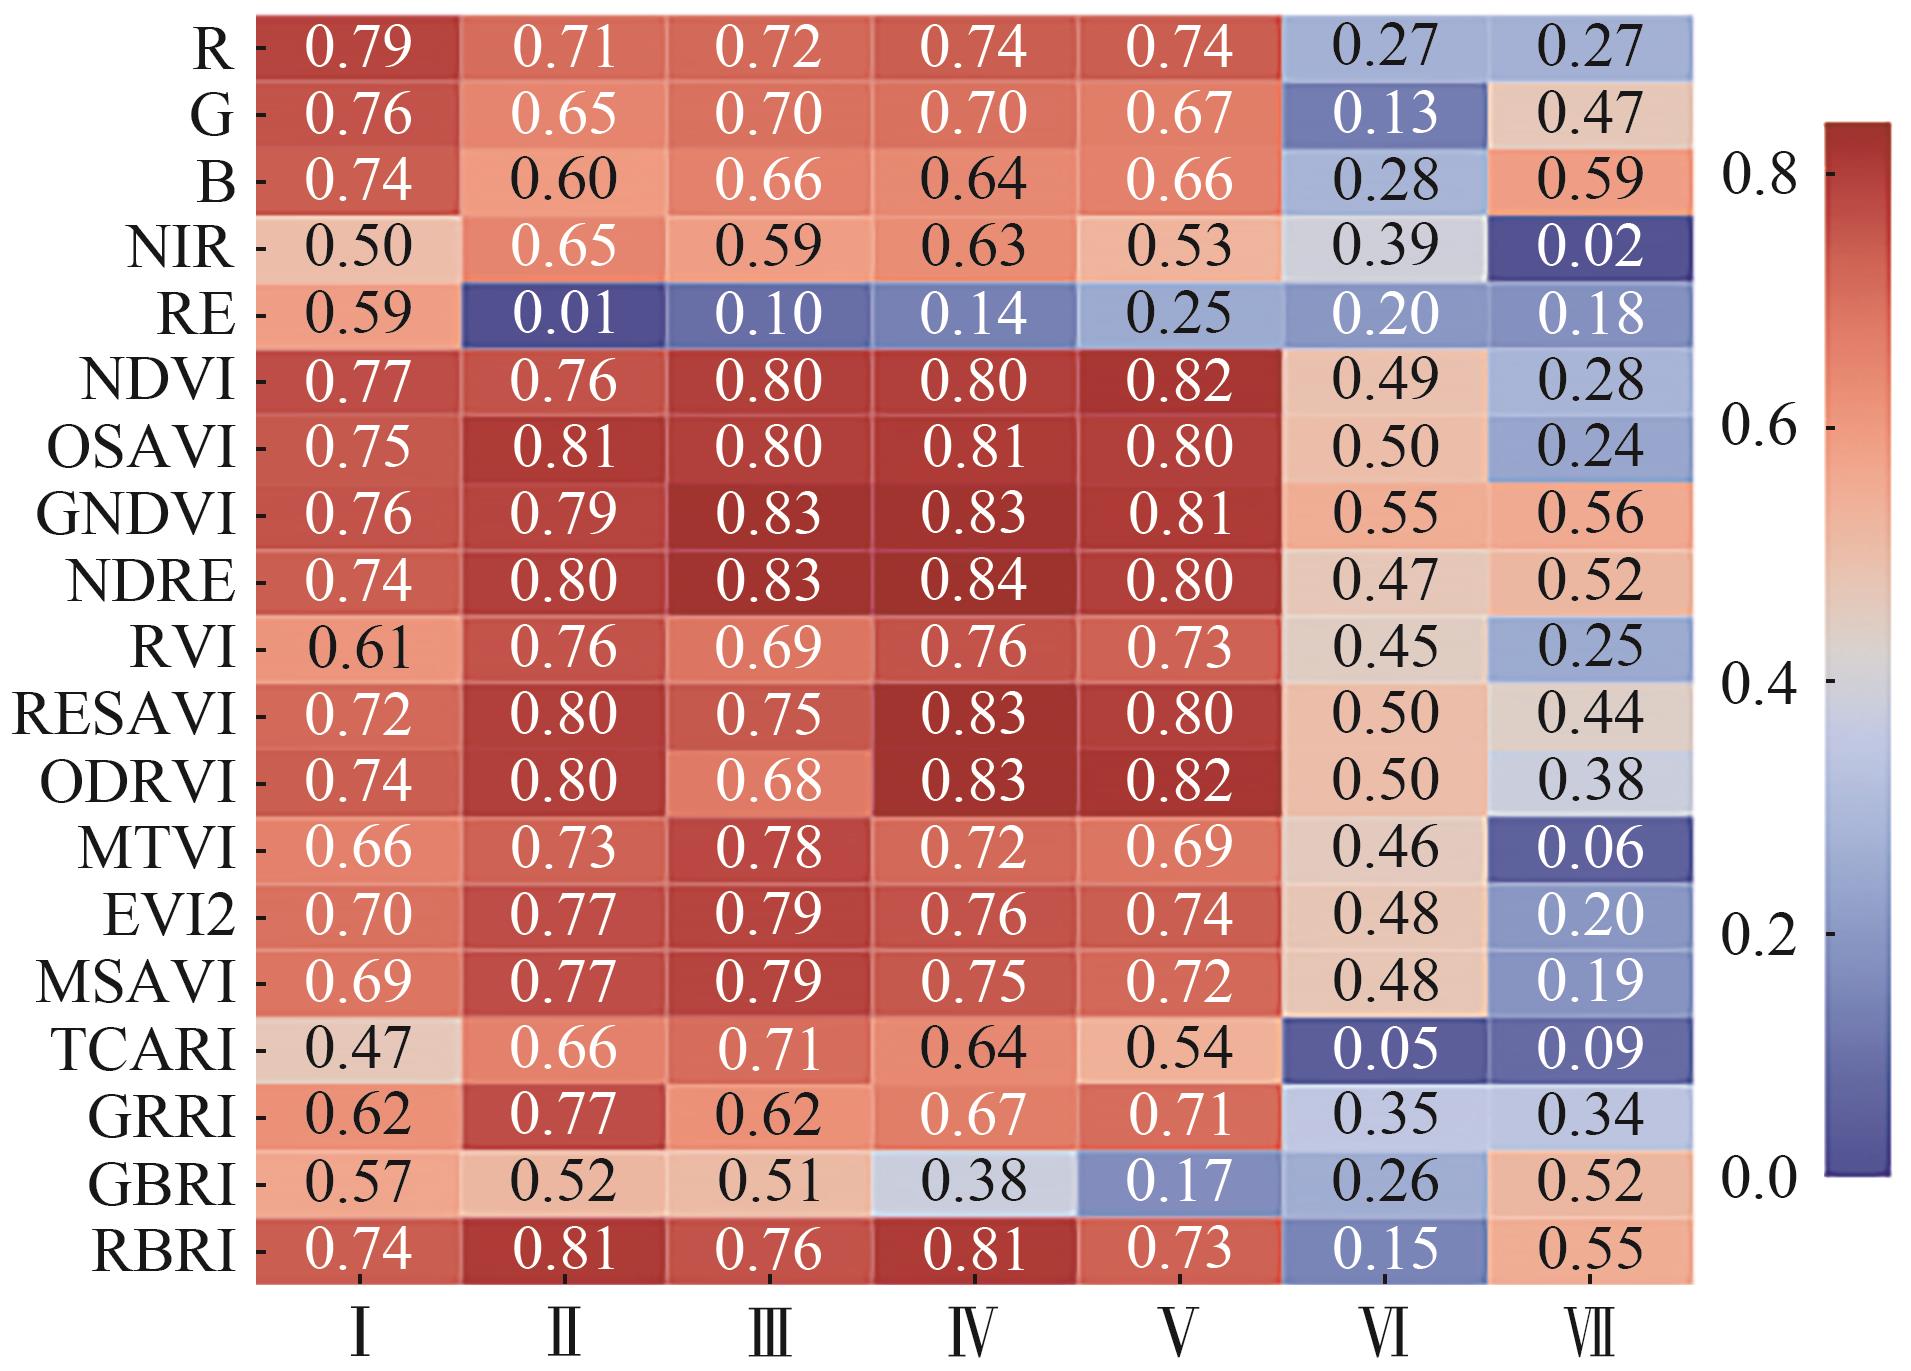
Correlation between multi-spectral bands and vegetation index and measured yield in the plot
|r|
Note:
Ⅰ: Elongation stage. Ⅱ: Flag leaf stage. Ⅲ: Flowering stage. Ⅳ: Early grain-filling stage. Ⅴ: Middle grain-filling stage. Ⅵ: Late grain-filling stage. Ⅶ: Wax-ripening stage.
Fig.4
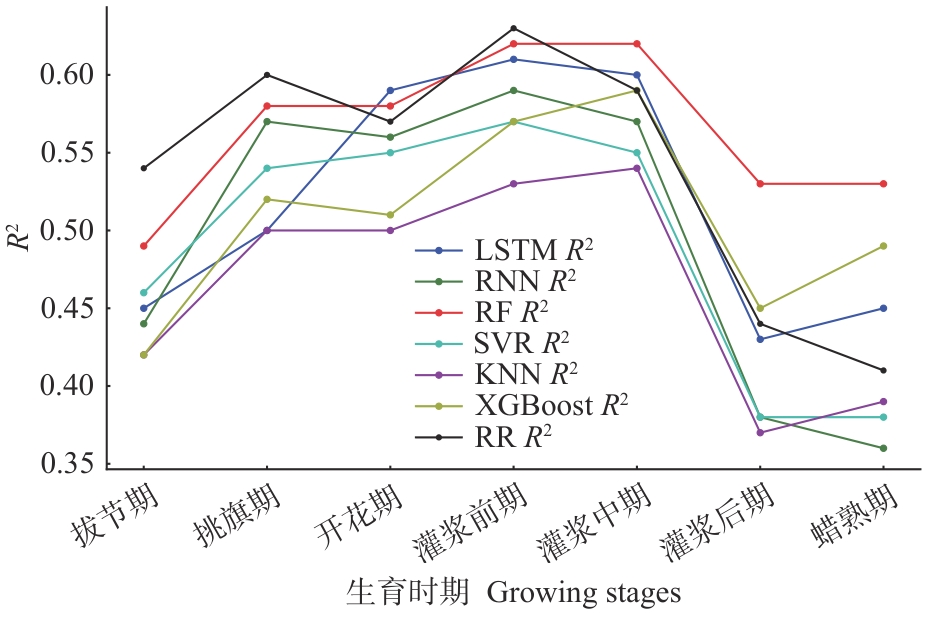
Coefficient of determination (
R
²) of crop yield prediction at different growth stages using various machine learning models
Fig.5
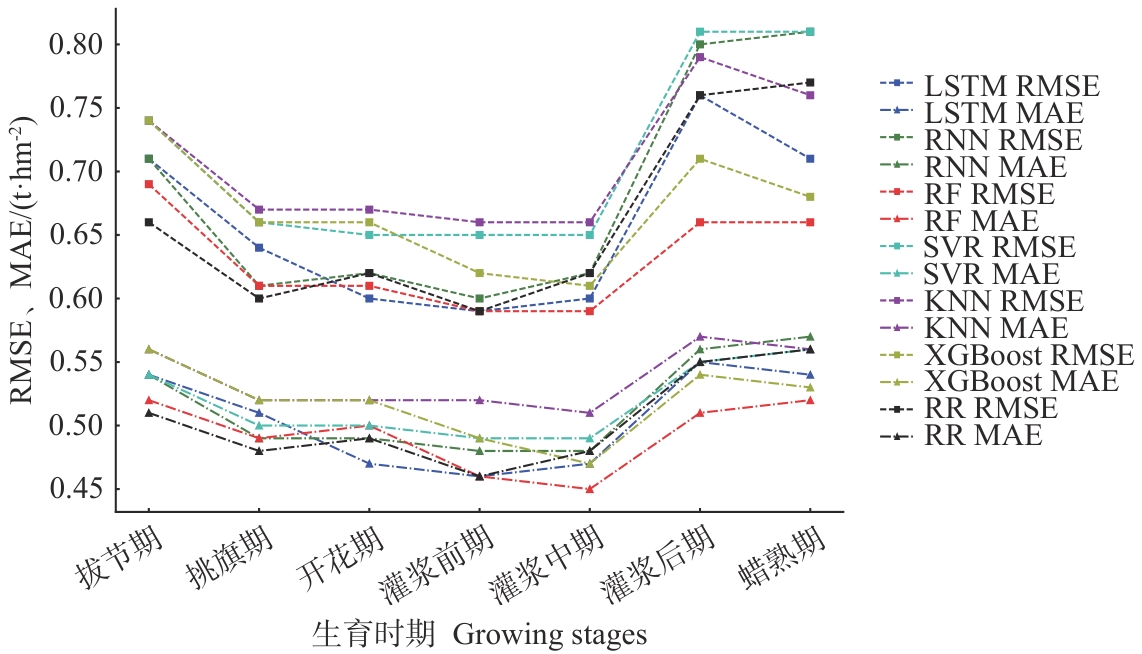
Root RMSE and MAE of crop yield prediction at different growth stages using various machine learning models
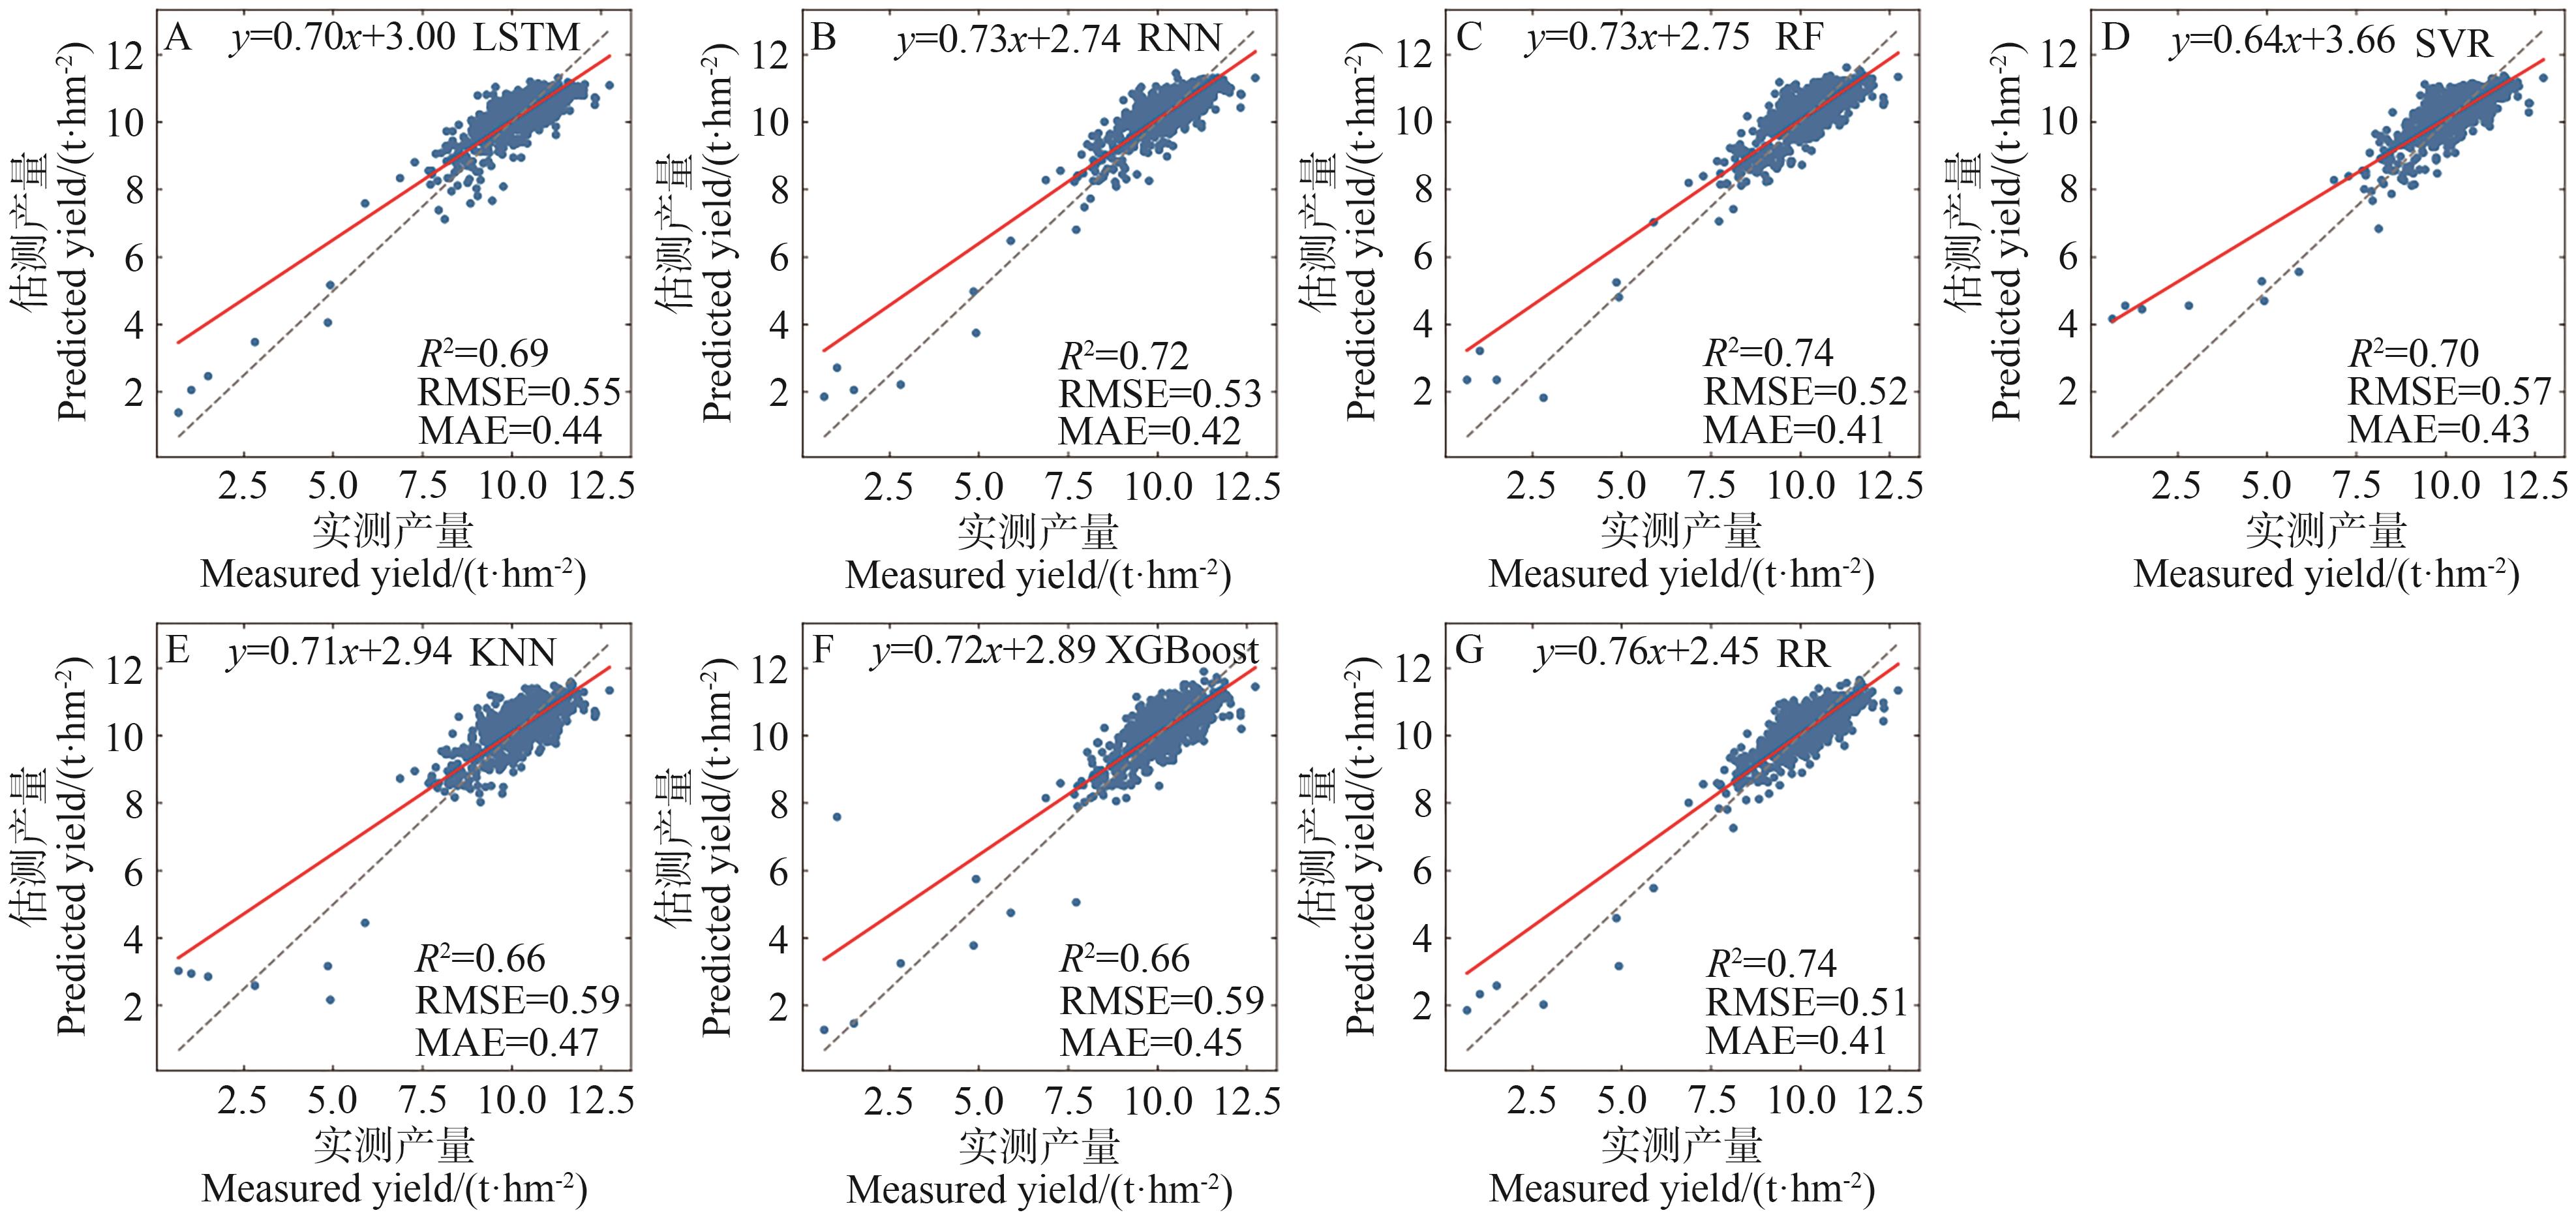
Fig.7
Scatter plots of predicted vs. observed yield values for each model
Note:
A, B, C, D, E, F, and G represent the LSTM, RNN, RF, SVR, KNN, XGBoost, and RR models, respectively. The gray dashed line represents the 1∶1 line between the actual production and the model prediction, the red line is the fitted line for the observed and predicted values, RMSE and MAE units are t·hm
-2
.
Fig.8
Scatter plots of predicted vs. observed yield values based on stratified sampling method
Note:
A, B, C, D, E, F, and G represent the LSTM, RNN, RF, SVR, KNN, XGBoost, and RR models, respectively. The gray dashed line represents the 1∶1 line between the actual production and the model prediction, the red line is the fitted line for the observed and predicted values, RMSE and MAE units are t·hm
-2
.
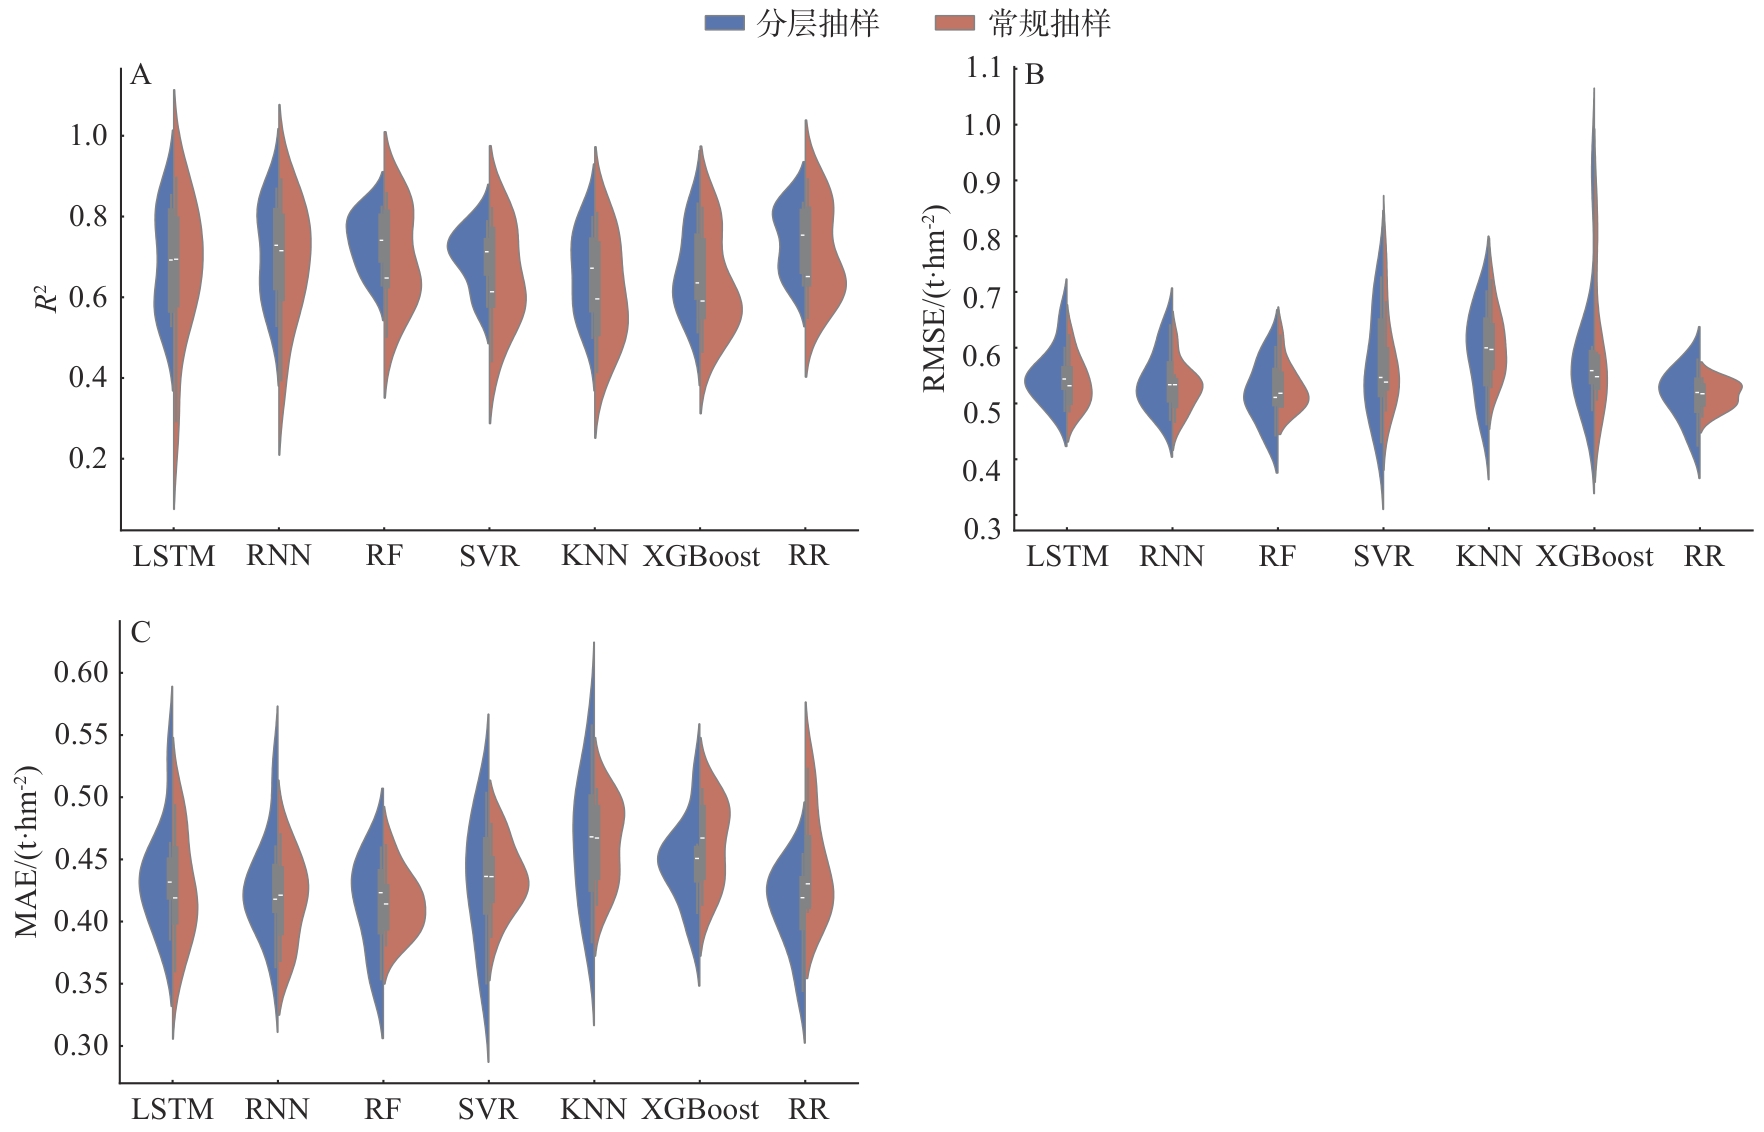
Fig.9
Comparison of prediction accuracy of machine learning models using random sampling and stratified sampling methods